B2Gold Reports Q1 2024 Results; Cash Operating Costs and All-In Sustaining Costs Below 2024 Annual Guidance Ranges; Update on Goose Project Following Successful Completion of 2024 Winter Ice Road Campaign
VANCOUVER, British Columbia, May 07, 2024 (GLOBE NEWSWIRE) -- B2Gold Corp. (TSX: BTO, NYSE AMERICAN: BTG, NSX: B2G) (“B2Gold” or the “Company”) announces its operational and financial results for the first quarter of 2024. All dollar figures are in United States dollars unless otherwise indicated.
2024 First Quarter Highlights
- Total gold production of 225,716 ounces in Q1 2024, in-line with expectations: Total gold production in the first quarter of 2024 was 225,716 ounces, including 11,377 ounces of attributable production from Calibre Mining Corp. (“Calibre”). All three B2Gold operations were in-line with expectations and the Company is on track to meet its consolidated annual production guidance range.
- Total consolidated cash operating costs of $734 per gold ounce produced in Q1 2024: Total consolidated cash operating costs (see “Non-IFRS Measures”) (including estimated attributable results for Calibre) of $734 per gold ounce produced during the first quarter of 2024 with consolidated cash operating costs from the Company’s three operating mines of $718 per gold ounce produced.
- Total consolidated all-in sustaining costs of $1,345 per gold ounce sold in Q1 2024: Total consolidated all-in sustaining costs (see “Non-IFRS Measures”) (including estimated attributable results for Calibre) of $1,345 per gold ounce sold with consolidated all-in sustaining costs from the Company’s three operating mines of $1,346 per gold ounce sold.
- Attributable net income of $0.03 per share; Adjusted attributable net income of $0.06 per share in Q1 2024: Net income attributable to the shareholders of the Company in the first quarter of 2024 of $40 million ($0.03 per share); adjusted net income (see “Non-IFRS Measures”) attributable to the shareholders of the Company of $82 million ($0.06 per share).
- Operating cash flow before working capital adjustments of $200 million in Q1 2024: Cash flow provided by operating activities before working capital adjustments and proceeds from prepaids financing was $200 million in the first quarter of 2024.
- Strong financial position and liquidity: At March 31, 2024, the Company had cash and cash equivalents of $568 million and working capital (defined as current assets less assets classified as held for sale and current liabilities) of $629 million.
- Q2 2024 dividend of $0.04 per share declared: On May 7, 2024, B2Gold's Board of Directors declared a cash dividend for the second quarter of 2024 of $0.04 per common share (or an expected $0.16 per share on an annualized basis), payable on June 24, 2024, to shareholders of record as of June 11, 2024. As of March 31, 2024, the expected annual dividend rate represented an approximate 6.1% yield.
- Goose Project 2024 winter ice road campaign successfully completed: Subsequent to quarter end, B2Gold successfully completed the 2024 winter ice road (“WIR”) campaign. Construction of the 162 kilometer (“km”) WIR began in December 2023 and the 2024 WIR campaign commenced in the first quarter of 2024. The 2024 WIR campaign was successfully completed on April 30, 2024, delivering all necessary materials from the Marine Laydown Area (“MLA”) to complete the construction of the Goose Project. Materials trucked from the MLA to the Goose Project site during the 2024 WIR campaign exceeded 2,100 total loads and included 400 loads of diesel fuel.
- Goose Project mill construction remains on schedule: The mill construction remains on schedule with work ongoing on various facilities related to concrete, steel erection and building cladding. Additionally, installation of the ball mill continues to progress ahead of schedule with the installation of all shell sections, feed/discharge heads, trunnion, pinion and bearings having been completed.
- Development of the open pit and underground is slightly behind schedule at the Goose Project; first gold production now expected in Q2 2025: Development of the open pit and underground is slightly behind schedule due to equipment availability (commissioning and availability of the open pit equipment), adverse weather conditions and prioritization of critical path construction activities. The current schedule indicates that an additional three months of mining must be added to the schedule to ensure that the Umwelt open pit, underground development, and crown pillar activities align and that there is sufficient tailings storage capacity in the Echo open pit. With the schedule change, the mill is now scheduled to produce first gold in the second quarter of 2025 with ramp up to full production in the third quarter of 2025 (one quarter later than previous estimates). As a result of the updated mining schedule, the Company now estimates that gold production in calendar year 2025 will be between 120,000 ounces and 150,000 ounces (previously estimated to be between 220,000 ounces and 260,000 ounces). The reduction in estimated gold production in 2025 is predominantly due to the deferral of an anticipated 100,000 ounces of quarterly gold production from the fourth quarter of 2025 into the first quarter of 2026. Importantly, the updated mining schedule does not impact the total number of gold ounces the Company expects to produce over the life of mine of the Goose Project. The updated production profile has resulted in the Company now estimating that average annual gold production from 2026 to 2030 will increase to be in excess of 310,000 ounces per year (previously estimated at 300,000 ounces per year).
- Positive exploration results from the Antelope deposit at the Otjikoto Mine in Namibia indicate potential for possible underground development: On January 31, 2024, the Company announced positive exploration drilling results from the Antelope deposit, located approximately three km south of the Otjikoto open pit. The Antelope deposit has the potential to be developed as an underground mining operation, which could complement the expected processing of low-grade stockpiles at the Otjikoto mill from 2026 through 2031.
- Fekola Complex technical report outlined the trucking of ore as the optimal option to maximize the value of Fekola Regional: The Fekola Complex technical report filed on March 14, 2024, outlined the trucking of ore from the Anaconda Area to be toll milled by the Fekola mill as the optimal option to maximize the value of Fekola Regional, and to extend the processing life of the Fekola mill. Trucking of selective higher-grade material from Fekola Regional to the Fekola mill will increase the ore processed and has the potential to generate approximately 80,000 to 100,000 ounces of initial gold production per year from Fekola Regional sources. Importantly, the haul road from Fekola Regional to the Fekola Mine is operational as construction of the haul roads and mining infrastructure (warehouse, workshop, fuel depot and offices) was completed on schedule in 2023.
- Updated Gramalote Preliminary Economic Assessment (“PEA”) on track for Q2 2024: B2Gold's in-house projects team is progressing work on various smaller scale project development plans for the Gramalote Project, with the goal of identifying a higher-return project than the previously contemplated joint venture development plan. B2Gold has completed a detailed review of the Gramalote Project, including the facility size and location, power supply, mining and processing options, tailings design, resettlement, potential construction sequencing and camp design to identify potential cost savings to develop a smaller scale project. The results of the review allowed the Company to determine the optimal parameters and assumptions for a formal study, which commenced in the fourth quarter of 2023, with a PEA expected to be complete by the end of the second quarter of 2024.
- Received an upfront payment of $500 million, to further enhance financial flexibility and provide additional cash liquidity: In January 2024, B2Gold entered into a series of prepaid gold sales (the “Gold Prepay”) with a number of existing lenders to further enhance financial flexibility and provide additional cash liquidity at attractive terms as the Company continues to fund sustaining, development and growth projects across the operating portfolio, and increase financial capacity for potential growth projects in Namibia and Colombia.
First Quarter 2024 Results
| Three months ended | ||
| March 31, | ||
| 2024 | 2023 | |
| Gold revenue ($ in thousands) | 461,444 | 473,556 |
| Net income ($ in thousands) | 48,481 | 101,904 |
| Earnings per share – basic(1) ($/ share) | 0.03 | 0.08 |
| Earnings per share – diluted(1) ($/ share) | 0.03 | 0.08 |
| Cash provided by operating activities ($ thousands) | 710,727 | 203,823 |
| Average realized gold price ($/ ounce) | 2,069 | 1,901 |
| Adjusted net income(1)(2) ($ in thousands) | 81,503 | 105,862 |
| Adjusted earnings per share(1)(2) – basic ($) | 0.06 | 0.10 |
| Consolidated operations results: | ||
| Gold sold (ounces) | 222,978 | 249,150 |
| Gold produced (ounces) | 214,339 | 250,719 |
| Production costs ($ in thousands) | 156,745 | 127,604 |
| Cash operating costs(2) ($/ gold ounce sold) | 703 | 512 |
| Cash operating costs(2) ($/ gold ounce produced) | 718 | 576 |
| Total cash costs(2) ($/ gold ounce sold) | 838 | 653 |
| All-in sustaining costs(2) ($/ gold ounce sold) | 1,346 | 1,049 |
| Operations results including equity investment in Calibre: | ||
| Gold sold (ounces) | 234,355 | 265,292 |
| Gold produced (ounces) | 225,716 | 266,856 |
| Production costs ($ in thousands) | 168,650 | 143,369 |
| Cash operating costs(2) ($/ gold ounce sold) | 720 | 540 |
| Cash operating costs(2) ($/ gold ounce produced) | 734 | 600 |
| Total cash costs(2) ($/ gold ounce sold) | 851 | 678 |
| All-in sustaining costs(2) ($/ gold ounce sold) | 1,345 | 1,060 |
(1) Attributable to the shareholders of the Company.
(2) Non-IFRS measure. For a description of how these measures are calculated and a reconciliation of these measures to the most directly comparable measures specified, defined or determined under IFRS and presented in the Company’s financial statements, refer to “Non-IFRS Measures”.
Liquidity and Capital Resources
B2Gold continues to maintain a strong financial position and liquidity. At March 31, 2024, the Company had cash and cash equivalents of $568 million (December 31, 2023 - $307 million) and working capital (defined as current assets less assets classified as held for sale and current liabilities) of $629 million (December 31, 2023 - $397 million). At March 31, 2024, the full amount of the Company's $700 million revolving credit facility was undrawn and available.
Second Quarter 2024 Dividend
On May 7, 2024, B2Gold’s Board of Directors declared a cash dividend for the second quarter of 2024 (the “Q2 2024 Dividend”) of $0.04 per common share (or an expected $0.16 per share on an annualized basis), payable on June 24, 2024, to shareholders of record as of June 11, 2024. As of March 31, 2024, the expected annual dividend rate represented an approximate 6.1% yield.
In 2023, the Company implemented a Dividend Reinvestment Plan (“DRIP”). For the purposes of the Q2 2024 Dividend, the Company is pleased to announce that a discount of 3% will be applied to calculate the Average Market Price (as defined in the DRIP) of its common shares issued from treasury. However, the Company may, from time to time, in its discretion, change or eliminate any applicable discount, which would be publicly announced, all in accordance with the terms and conditions of the DRIP. Participation in the DRIP is optional. In order to participate in the DRIP in time for the Q2 2024 Dividend, registered shareholders must deliver a properly completed enrollment form to Computershare Trust Company of Canada by no later than 4:00 p.m. (Toronto time) on June 4, 2024. Beneficial shareholders who wish to participate in the DRIP should contact their financial advisor, broker, investment dealer, bank, financial institution, or other intermediary through which they hold common shares well in advance of the above date for instructions on how to enroll in the DRIP.
As part of the long-term strategy to maximize shareholder value, B2Gold expects to declare future quarterly dividends at the same level. This dividend is designated as an "eligible dividend" for the purposes of the Income Tax Act (Canada). Dividends paid by B2Gold to shareholders outside Canada (non-resident investors) will be subject to Canadian non-resident withholding taxes.
The declaration and payment of future dividends and the amount of any such dividends will be subject to the determination of the Board, in its sole and absolute discretion, taking into account, among other things, economic conditions, business performance, financial condition, growth plans, expected capital requirements, compliance with B2Gold's constating documents, all applicable laws, including the rules and policies of any applicable stock exchange, as well as any contractual restrictions on such dividends, including any agreements entered into with lenders to the Company, and any other factors that the Board deems appropriate at the relevant time. There can be no assurance that any dividends will be paid at the intended rate or at all in the future.
For more information regarding the DRIP and enrollment in the DRIP, please refer to the Company's website at https://www.b2gold.com/investors/stock_info/.
This news release does not constitute an offer to sell or the solicitation of an offer to buy securities in any jurisdiction nor will there be any sale of these securities in any province, state or jurisdiction in which such offer, solicitation or sale would be unlawful prior to registration or qualification under the securities laws of any such province, state or jurisdiction.
The Company has filed a registration statement relating to the DRIP with the U.S. Securities and Exchange Commission that may be obtained under the Company's profile on the U.S. Securities and Exchange Commission's website at http://www.sec.gov/EDGAR or by contacting the Company using the contact information at the end of this news release.
Operations
Fekola Mine - Mali
| Three months ended | ||
| March 31, | ||
| 2024 | 2023 | |
| Gold revenue ($ in thousands) | 256,318 | 314,225 |
| Gold sold (ounces) | 123,828 | 165,050 |
| Average realized gold price ($/ ounce) | 2,070 | 1,904 |
| Tonnes of ore milled | 2,462,863 | 2,271,891 |
| Grade (grams/ tonne) | 1.62 | 2.47 |
| Recovery (%) | 92.7 | 91.9 |
| Gold production (ounces) | 119,141 | 165,864 |
| Production costs ($ in thousands) | 85,105 | 77,661 |
| Cash operating costs(1) ($/ gold ounce sold) | 687 | 471 |
| Cash operating costs(1) ($/ gold ounce produced) | 698 | 483 |
| Total cash costs(1) ($/ gold ounce sold) | 852 | 632 |
| All-in sustaining costs(1) ($/ gold ounce sold) | 1,436 | 964 |
| Capital expenditures ($ in thousands) | 80,562 | 53,795 |
| Exploration ($ in thousands) | 1,302 | 1,706 |
(1) Non-IFRS measure. For a description of how these measures are calculated and a reconciliation of these measures to the most directly comparable measures specified, defined or determined under IFRS and presented in the Company’s financial statements, refer to “Non-IFRS Measures”.
The Fekola Mine in Mali (owned 80% by the Company and 20% by the State of Mali) had a strong start to the year with gold production for the first quarter of 2024 of 119,141 ounces, in-line with expectations. For the first quarter of 2024, mill feed grade was 1.62 grams per tonne (“g/t”), mill throughput was 2.46 million tonnes, and gold recovery averaged 92.7%.
The Fekola Mine’s cash operating costs (see “Non-IFRS Measures”) for the first quarter of 2024 were $698 per gold ounce produced ($687 per gold ounce sold). Cash operating costs per gold ounce produced for the first quarter of 2024 were lower than expected as a result of lower fuel costs, higher mill throughput, higher gold recovery and lower mining costs due to lower than anticipated mined tonnage as a result of equipment availability.
All-in sustaining costs (see “Non-IFRS Measures”) for the first quarter of 2024 for the Fekola Mine were $1,436 per gold ounce sold. All-in sustaining costs were lower than expected as a result of lower than anticipated production costs per gold ounce sold, higher gold ounces sold and lower than expected sustaining capital expenditures, partially offset by higher gold royalties resulting from a higher than anticipated average realized gold price. The lower sustaining capital expenditures were mainly due to timing of expenditures and are expected to be incurred later in 2024.
Capital expenditures in the first quarter of 2024 totalled $81 million primarily consisting of $29 million for deferred stripping, $18 million for mobile equipment purchases and rebuilds, $13 million for the construction of a new tailings storage facility, $11 million for Fekola underground development, $3 million for solar plant expansion and $2 million for haul road construction.
The Fekola Complex is comprised of the Fekola Mine (Medinandi permit hosting the Fekola and Cardinal pits and Fekola underground) and Fekola Regional (Anaconda Area (Bantako, Menankoto, and Bakolobi permits) and the Dandoko permit). The Fekola Complex is expected to produce between 470,000 and 500,000 ounces of gold in 2024 at cash operating costs of between $835 and $895 per ounce and all-in sustaining costs of between $1,420 and $1,480 per ounce. The Fekola Complex's total 2024 gold production is anticipated to decrease relative to 2023 due to lower production as a result of the delay in receiving an exploitation license for Fekola Regional from the Government of Mali pending finalization of an implementation decree for the new 2023 Mining Code. No production is forecast from Fekola Regional in the Company's 2024 guidance with production now expected to commence at the beginning of 2025.
The Fekola Mine is expected to process 9.4 million tonnes of ore during 2024 at an average grade of 1.77 g/t gold with a process gold recovery of 90.9%. Gold production is expected to be evenly weighted between the first half of 2024 and the second half of 2024.
Masbate Mine – The Philippines
| Three months ended | ||
| March 31, | ||
| 2024 | 2023 | |
| Gold revenue ($ in thousands) | 98,967 | 56,992 |
| Gold sold (ounces) | 47,700 | 29,650 |
| Average realized gold price ($/ ounce) | 2,075 | 1,922 |
| Tonnes of ore milled | 2,169,462 | 2,069,042 |
| Grade (grams/ tonne) | 0.99 | 0.95 |
| Recovery (%) | 72.4 | 73.5 |
| Gold production (ounces) | 49,782 | 46,364 |
| Production costs ($ in thousands) | 42,771 | 24,993 |
| Cash operating costs(1) ($/ gold ounce sold) | 897 | 843 |
| Cash operating costs(1) ($/ gold ounce produced) | 835 | 883 |
| Total cash costs(1) ($/ gold ounce sold) | 1,010 | 992 |
| All-in sustaining costs(1) ($/ gold ounce sold) | 1,219 | 1,320 |
| Capital expenditures ($ in thousands) | 8,530 | 8,953 |
| Exploration ($ in thousands) | 821 | 959 |
(1) Non-IFRS measure. For a description of how these measures are calculated and a reconciliation of these measures to the most directly comparable measures specified, defined or determined under IFRS and presented in the Company’s financial statements, refer to “Non-IFRS Measures”.
The Masbate Mine in the Philippines had a strong start to 2024 with first quarter gold production of 49,782 ounces, above expectations due to higher mill throughput. For the first quarter of 2024, mill feed grade was 0.99 g/t gold, mill throughput was 2.17 million tonnes, and gold recovery averaged 72.4%.
The Masbate Mine's cash operating costs (see “Non-IFRS Measures”) for the first quarter of 2024 were $835 per gold ounce produced ($897 per gold ounce sold). Cash operating costs per gold ounce produced for the first quarter of 2024 were lower than expected as a result of higher gold production and lower than anticipated mining and processing costs due to higher productivity and lower diesel and heavy fuel oil costs.
All-in sustaining costs (see “Non-IFRS Measures”) for the first quarter of 2024 were $1,219 per gold ounce sold. All-in sustaining costs for the first quarter of 2024 were lower than expected as a result of lower than anticipated production costs per gold ounce sold and lower than expected sustaining capital expenditures. The lower sustaining capital expenditures were mainly a result of timing of expenditures and are expected to be incurred later in 2024.
Capital expenditures in the first quarter of 2024 totalled $9 million, primarily consisting of $6 million for mobile equipment purchases and rebuilds and $1 million for deferred stripping.
The Masbate Mine is expected to produce between 170,000 and 190,000 ounces of gold in 2024 at cash operating costs of between $945 and $1,005 per ounce and all-in sustaining costs of between $1,300 and $1,360 per ounce. Gold production is scheduled to be relatively consistent throughout 2024. For 2024, Masbate is expected to process 7.9 million tonnes of ore at an average grade of 0.93 g/t gold with a process gold recovery of 76.0%. Mill feed will be a blend of mined fresh ore and low-grade ore stockpiles.
Otjikoto Mine - Namibia
| Three months ended | ||
| March 31, | ||
| 2024 | 2023 | |
| Gold revenue ($ in thousands) | 106,159 | 102,339 |
| Gold sold (ounces) | 51,450 | 54,450 |
| Average realized gold price ($/ ounce) | 2,063 | 1,880 |
| Tonnes of ore milled | 826,477 | 823,952 |
| Grade (grams/ tonne) | 1.74 | 1.47 |
| Recovery (%) | 98.5 | 98.8 |
| Gold production (ounces) | 45,416 | 38,491 |
| Production costs ($ in thousands) | 28,869 | 24,950 |
| Cash operating costs(1) ($/ gold ounce sold) | 561 | 458 |
| Cash operating costs(1) ($/ gold ounce produced) | 642 | 605 |
| Total cash costs(1) ($/ gold ounce sold) | 644 | 533 |
| All-in sustaining costs(1) ($/ gold ounce sold) | 958 | 905 |
| Capital expenditures ($ in thousands) | 13,813 | 17,346 |
| Exploration ($ in thousands) | 1,789 | 494 |
(1) Non-IFRS measure. For a description of how these measures are calculated and a reconciliation of these measures to the most directly comparable measures specified, defined or determined under IFRS and presented in the Company’s financial statements, refer to “Non-IFRS Measures”.
The Otjikoto Mine in Namibia, in which the Company holds a 90% interest, performed well during the first quarter of 2024, producing 45,416 ounces of gold, above expectations as a result of higher than anticipated mill feed grade. For the first quarter of 2024, mill feed grade was 1.74 g/t, mill throughput was 0.83 million tonnes, and gold recovery averaged 98.5%.
Ore production from the Wolfshag underground mine for the first quarter of 2024 averaged over 1,500 tonnes per day at an average grade of 4.06 g/t gold. As of the beginning of 2024, the Probable Mineral Reserve estimate for the Wolfshag deposit includes 100,000 ounces of gold in 0.6 million tonnes of ore at an average grade of 5.02 g/t gold. Open pit mining operations at the Otjikoto Mine will continue to ramp down in 2024 and conclude in 2025, while processing operations are expected to continue until economically viable stockpiles are exhausted in 2031. Underground operations are currently projected to continue until 2026 with potential to extend underground operations if the ongoing underground exploration program is successful in identifying more underground mineral deposits.
On January 31, 2024, the Company announced positive exploration drilling results from the Antelope deposit at the Otjikoto Mine. The Antelope deposit, comprised of the Springbok Zone, the Oryx Zone, and a possible third structure, Impala, subject to further confirmatory drilling, is located approximately three km south of the Otjikoto open pit. The Antelope deposit has the potential to be developed as an underground mining operation, which could complement the expected processing of low-grade stockpiles at the Otjikoto mill from 2026 through 2031.
Cash operating costs (see “Non-IFRS Measures”) for the first quarter of 2024 were $642 per gold ounce produced ($561 per ounce gold sold). Cash operating costs per gold ounce produced for the first quarter of 2024 were lower than expected as a result of higher production and a weaker Namibian dollar. Cash operating costs per gold ounce sold for the first quarter of 2024 were lower than the cash operating costs per ounce produced for the first quarter of 2024 as a result of the sale of lower cost inventory produced in the fourth quarter of 2023.
All-in sustaining costs (see “Non-IFRS Measures”) for the first quarter of 2024 were $958 per gold ounce sold. All-in sustaining costs for the first quarter of 2024 were lower than expected as a result of lower than anticipated cash operating costs, higher than anticipated gold ounces sold and lower than expected sustaining capital expenditures, partially offset by higher gold royalties resulting from a higher than expected average realized gold price. The lower sustaining capital expenditures were mainly a result of timing of expenditures and are expected to be incurred later in 2024.
Capital expenditures for the first quarter of 2024 totalled $14 million, consisting of $11 million for deferred stripping in the Otjikoto pit and $3 million for Wolfshag underground mine development.
The Otjikoto Mine is expected to produce between 180,000 and 200,000 ounces of gold in 2024 at cash operating costs of between $685 and $745 per ounce and all-in sustaining costs of between $960 and $1,020 per ounce. Gold production at Otjikoto is expected to be relatively consistent throughout 2024. For 2024, Otjikoto is expected to process a total of 3.4 million tonnes of ore at an average grade of 1.77 g/t gold with a process gold recovery of 98.0%. Processed ore will be sourced from the Otjikoto pit and the Wolfshag underground mine, supplemented by existing medium and high-grade ore stockpiles.
Goose Project Development
The Back River Gold District consists of five mineral claims blocks along an 80 km belt. Construction is underway at the most advanced project in the district, the Goose Project, and has been de-risked with significant infrastructure currently in place.
B2Gold recognizes that respect and collaboration with the Kitikmeot Inuit Association (“KIA”) is central to the license to operate in the Back River Gold District and will continue to prioritize developing the project in a manner that recognizes Inuit priorities, addresses concerns and brings long-term socio-economic benefits to the Kitikmeot Region. B2Gold looks forward to continuing to build on its strong collaboration with the KIA and Kitikmeot Communities.
Following the successful completion of the 2023 sealift, construction of the 162 km WIR between the MLA and the Goose Project site began in December 2023. The 2024 WIR campaign completed on April 30, 2024, and B2Gold is pleased to report that the Company has successfully delivered all necessary materials required to complete construction of the Goose Project. Materials trucked from the MLA to the Goose Project site during the 2024 WIR campaign exceeded 2,100 total loads and included 400 loads of diesel fuel. Under B2Gold management, the 2,100 loads completed during the 2024 WIR campaign is approximately double the loads completed during the 2023 WIR campaign. Key materials delivered during the 2024 WIR campaign included all modular units necessary to expand the camp to 500 person capacity; all steel and rebar necessary to complete the mill and concrete work; approximately 19 million liters of fuel that will be used between May 2024 and March 2025; all cement necessary to complete the construction project; more than 4,500m3 of cement in one tonne bags; and all reagents necessary to commission and operate the mill starting in 2025.
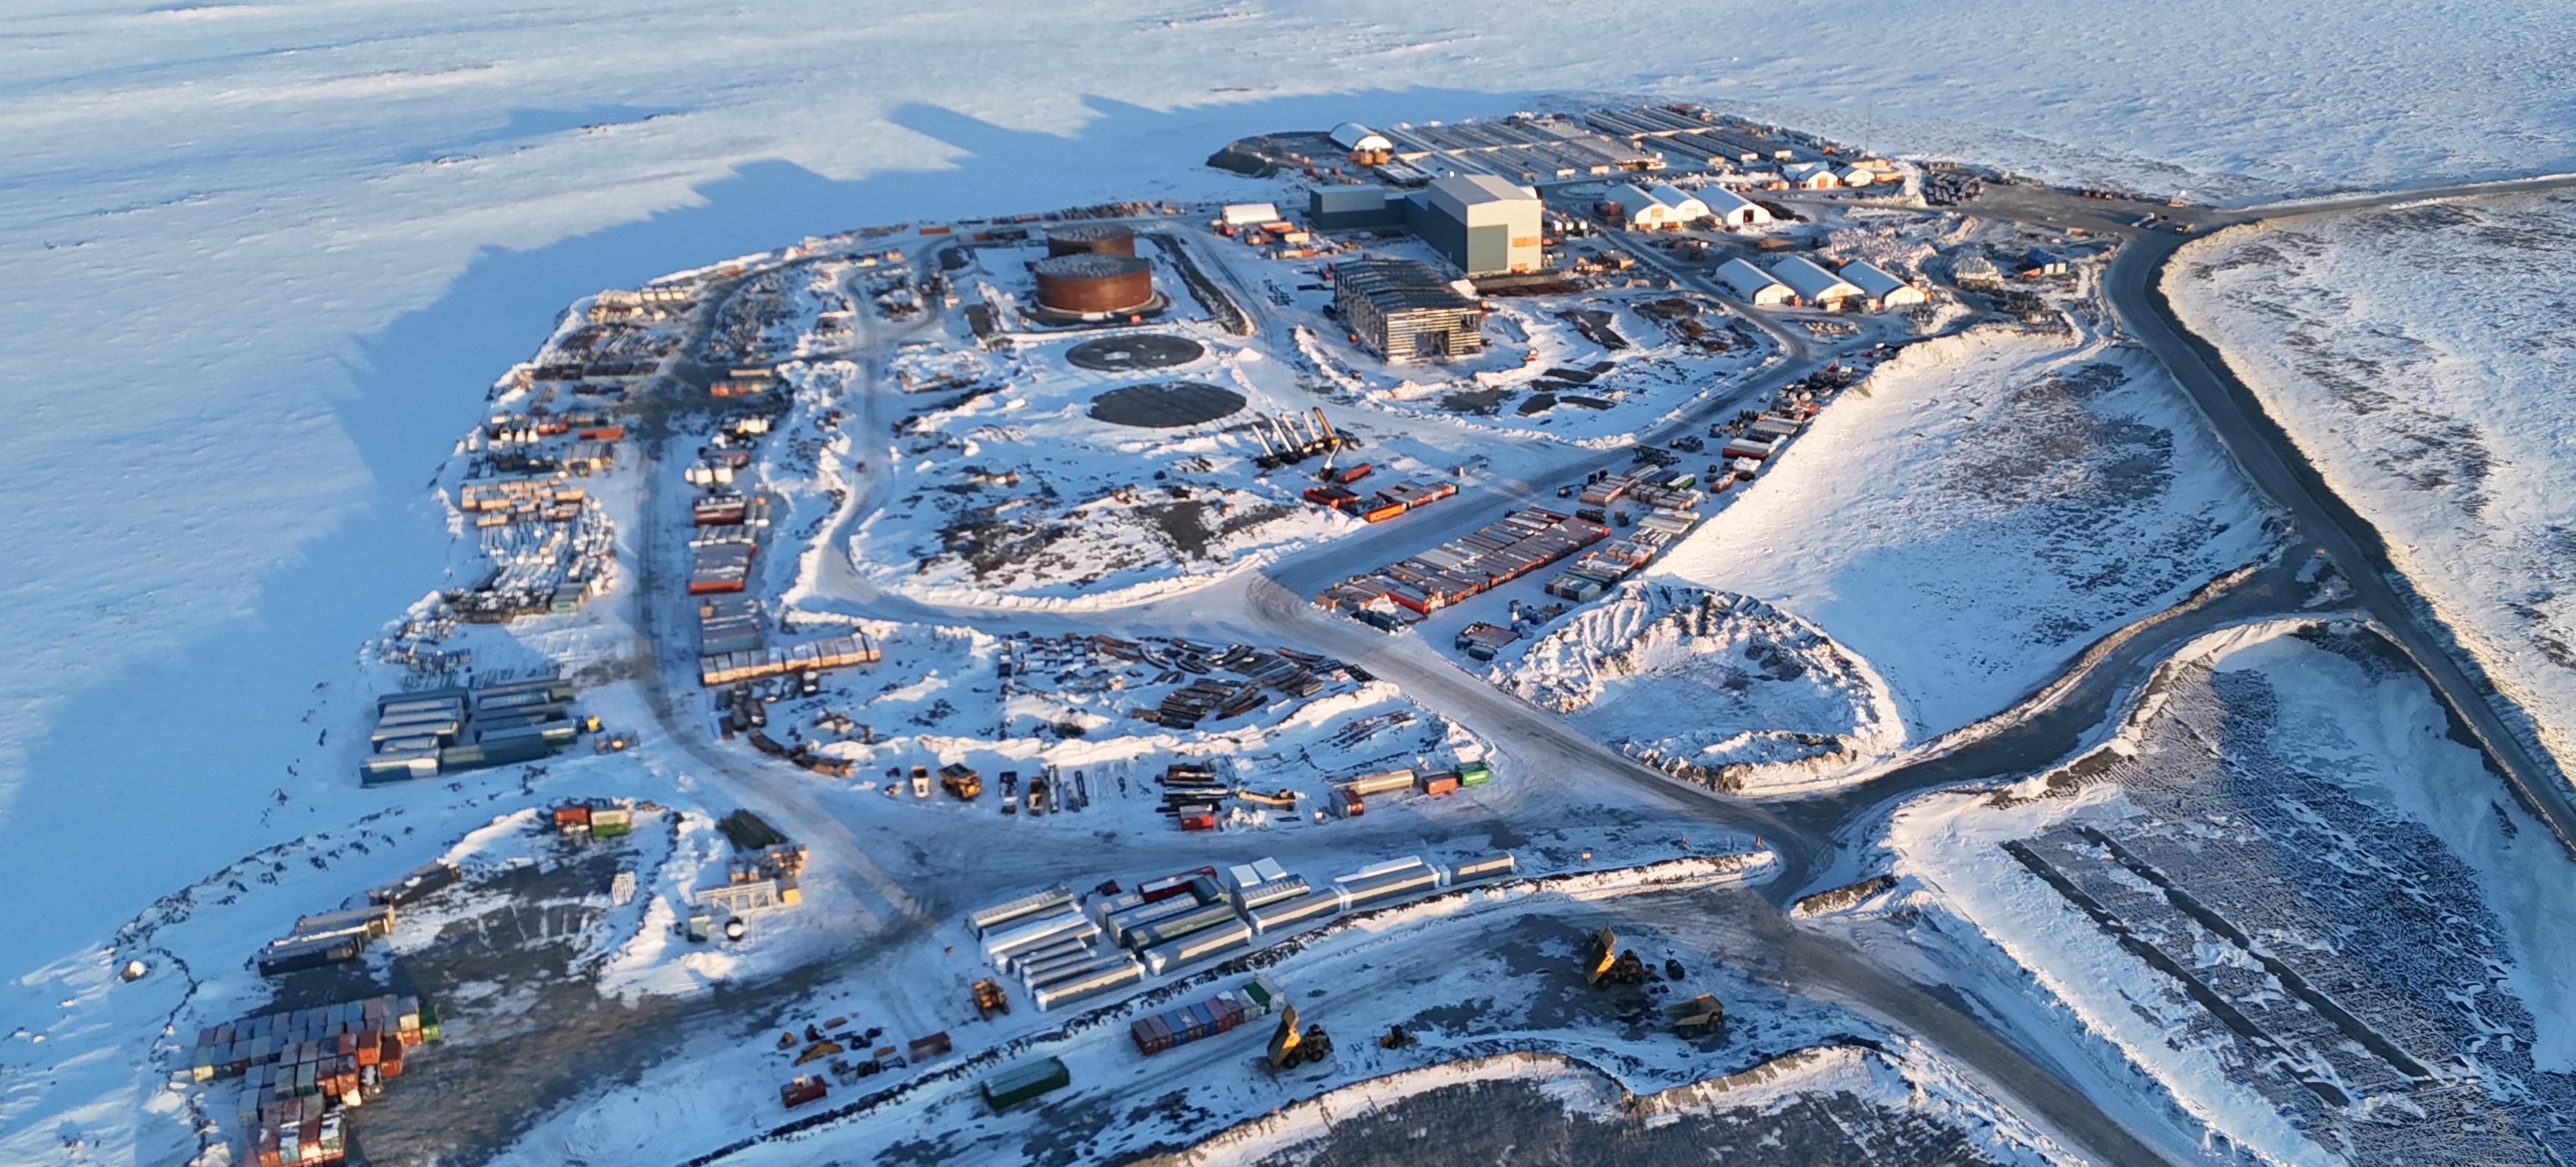
Goose Project site laydown area – April 2024
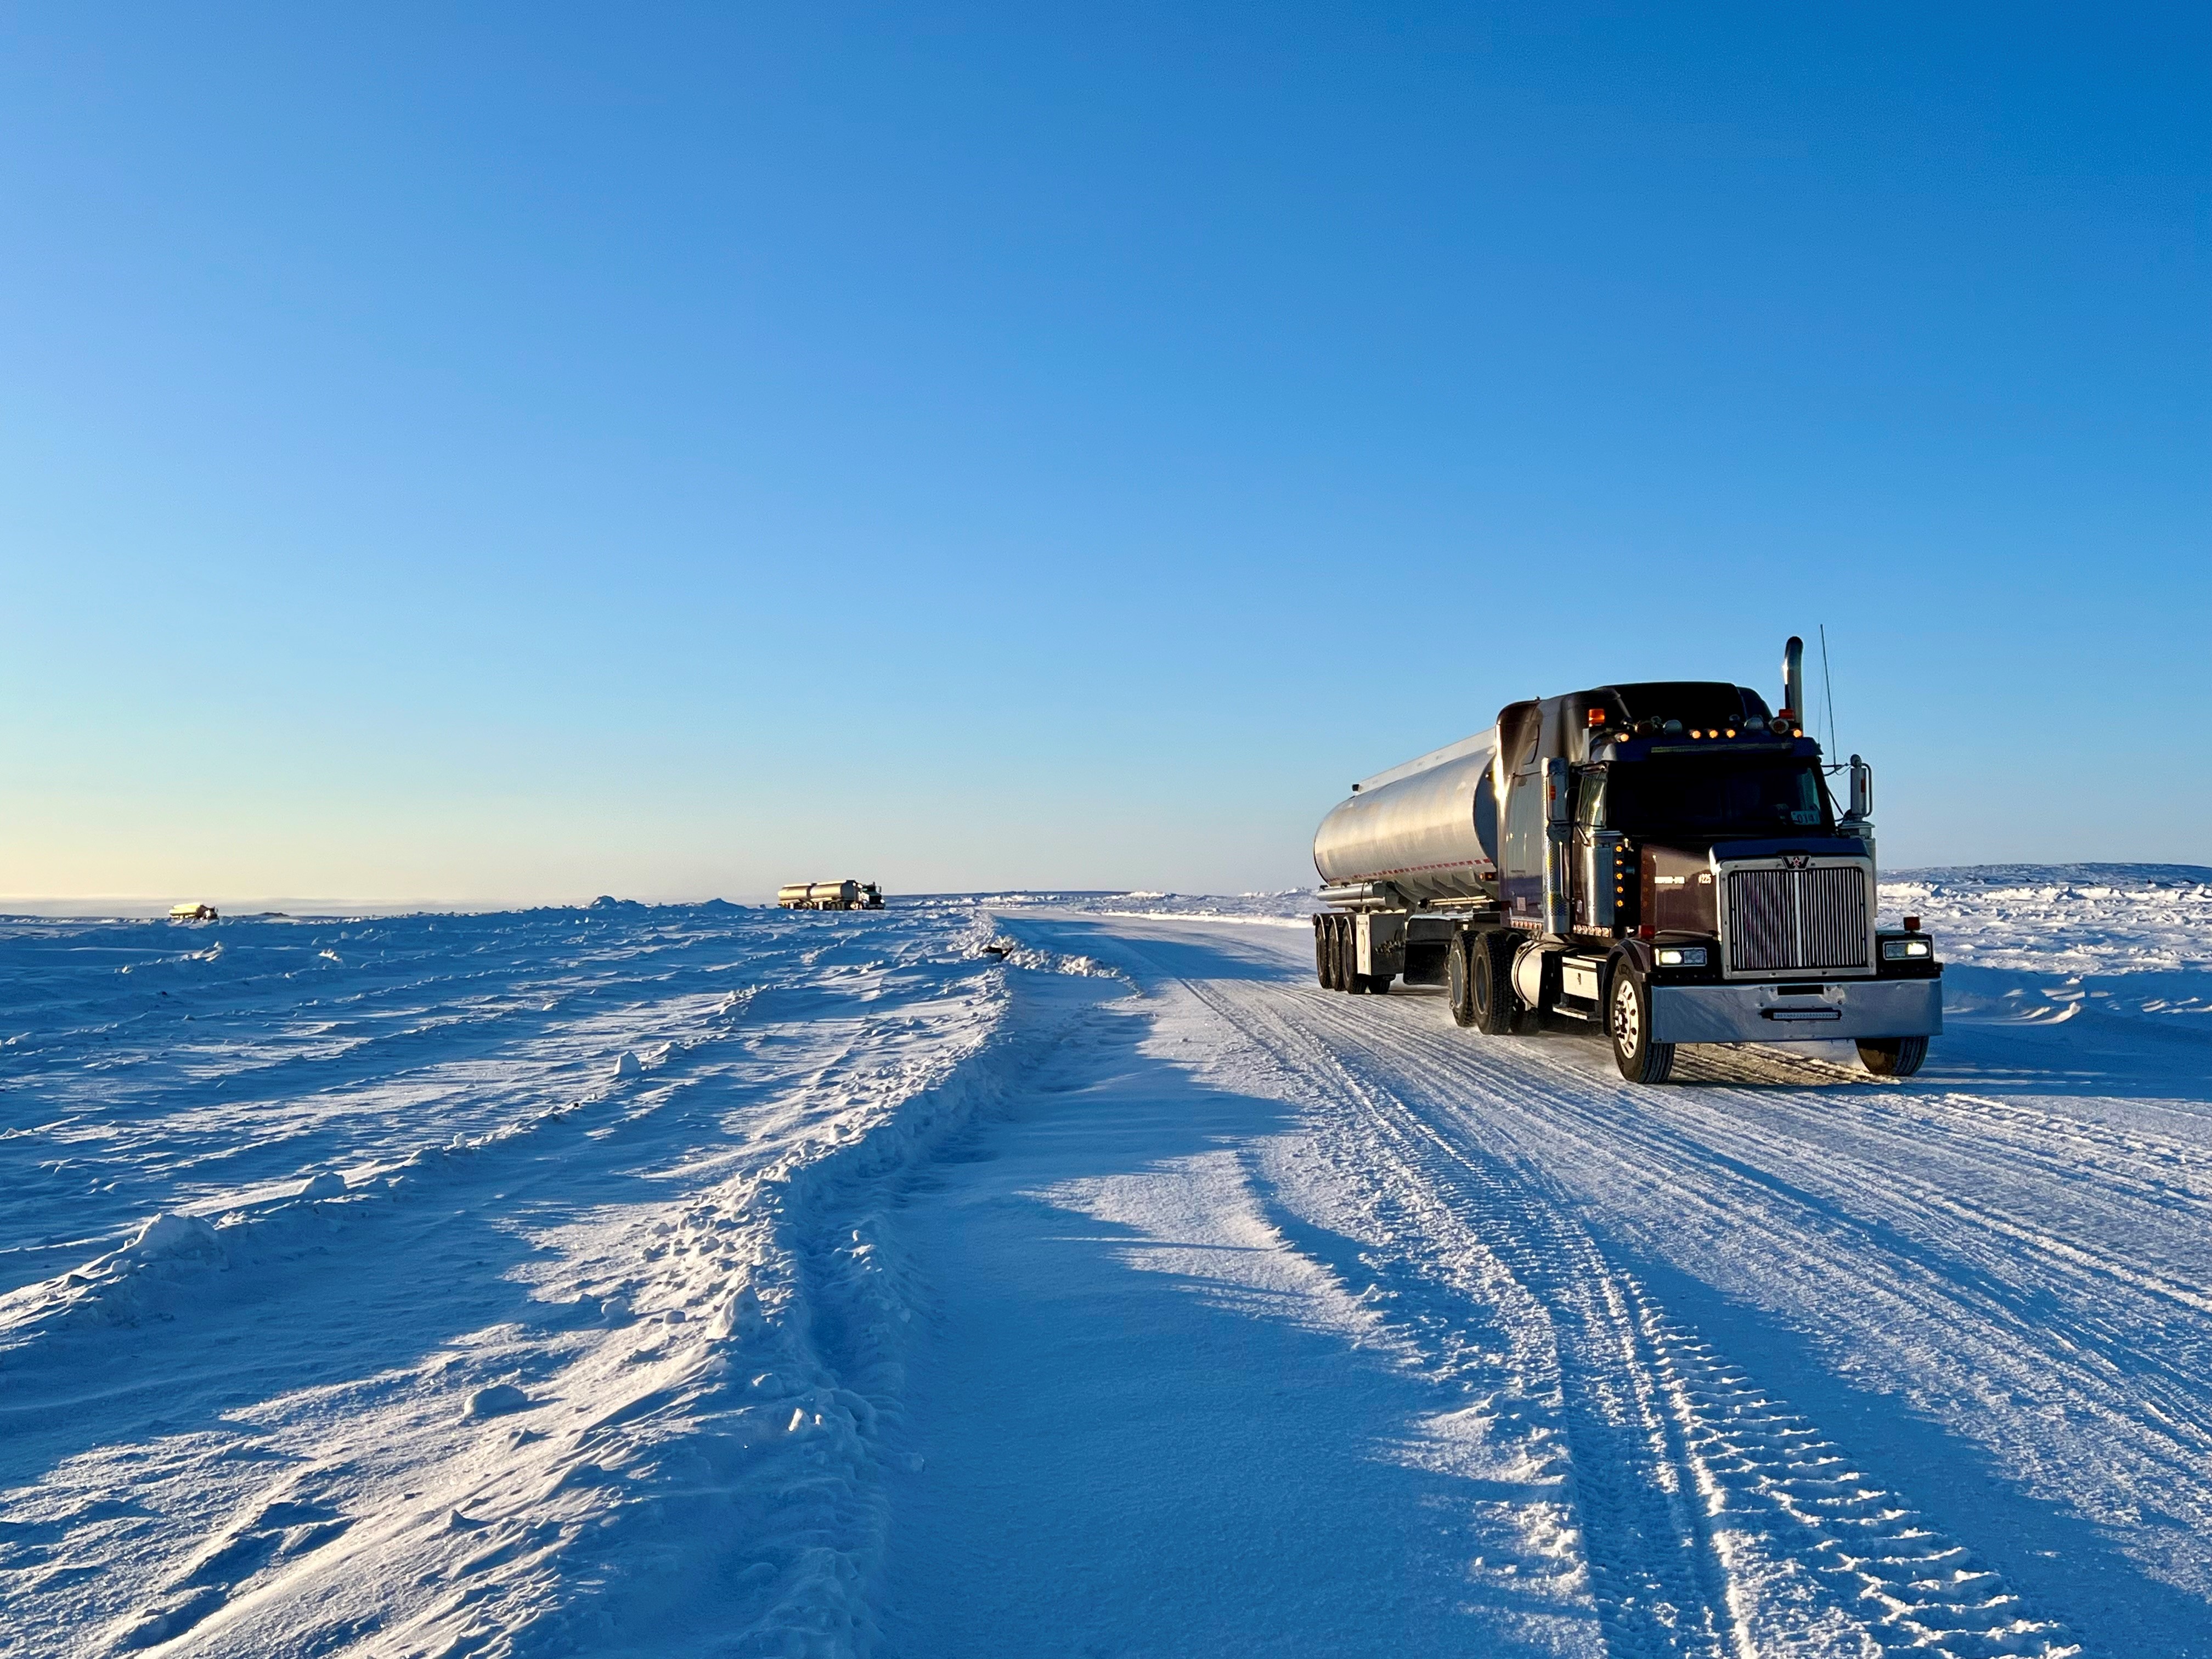
Winter ice road – March 2024
As of the end of April 2024, all additional camp modules were on site and set in place. The camp will be expanded from 300 beds to 500 beds through six additional dorm wings and a small office complex wing. More than 120 new additional beds are currently ready to be occupied, with the full accommodation complex expansion expected to be complete by the end of May 2024.
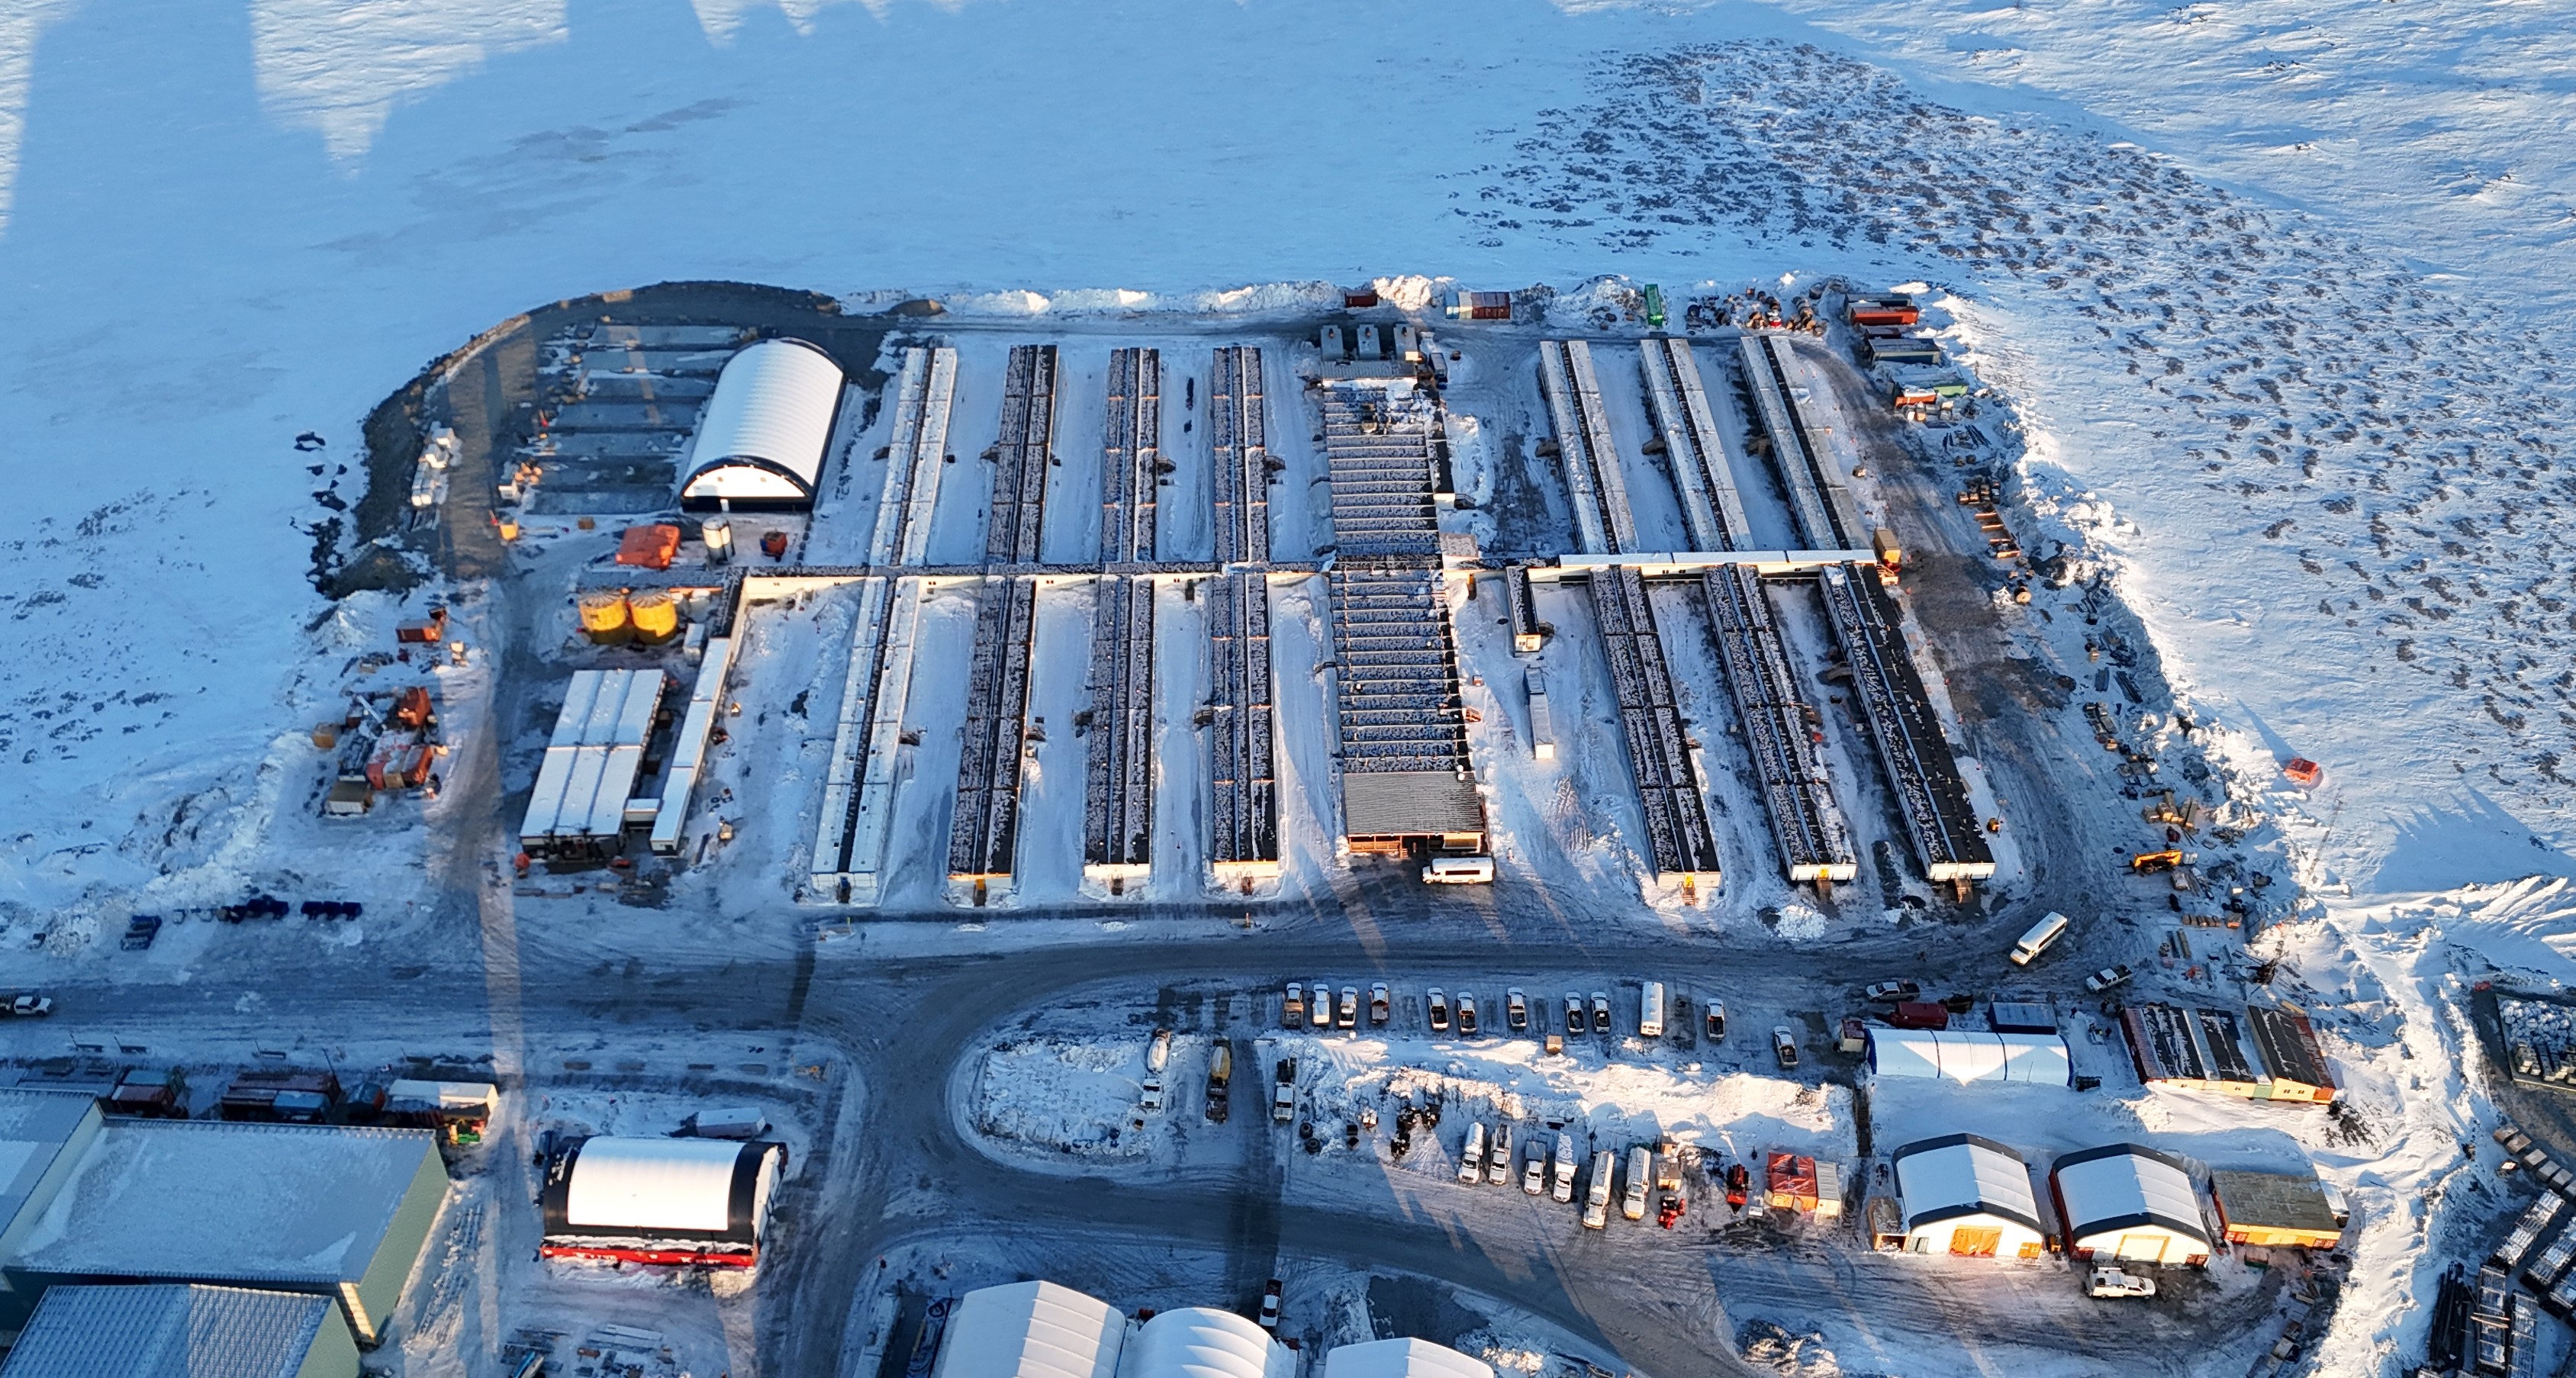
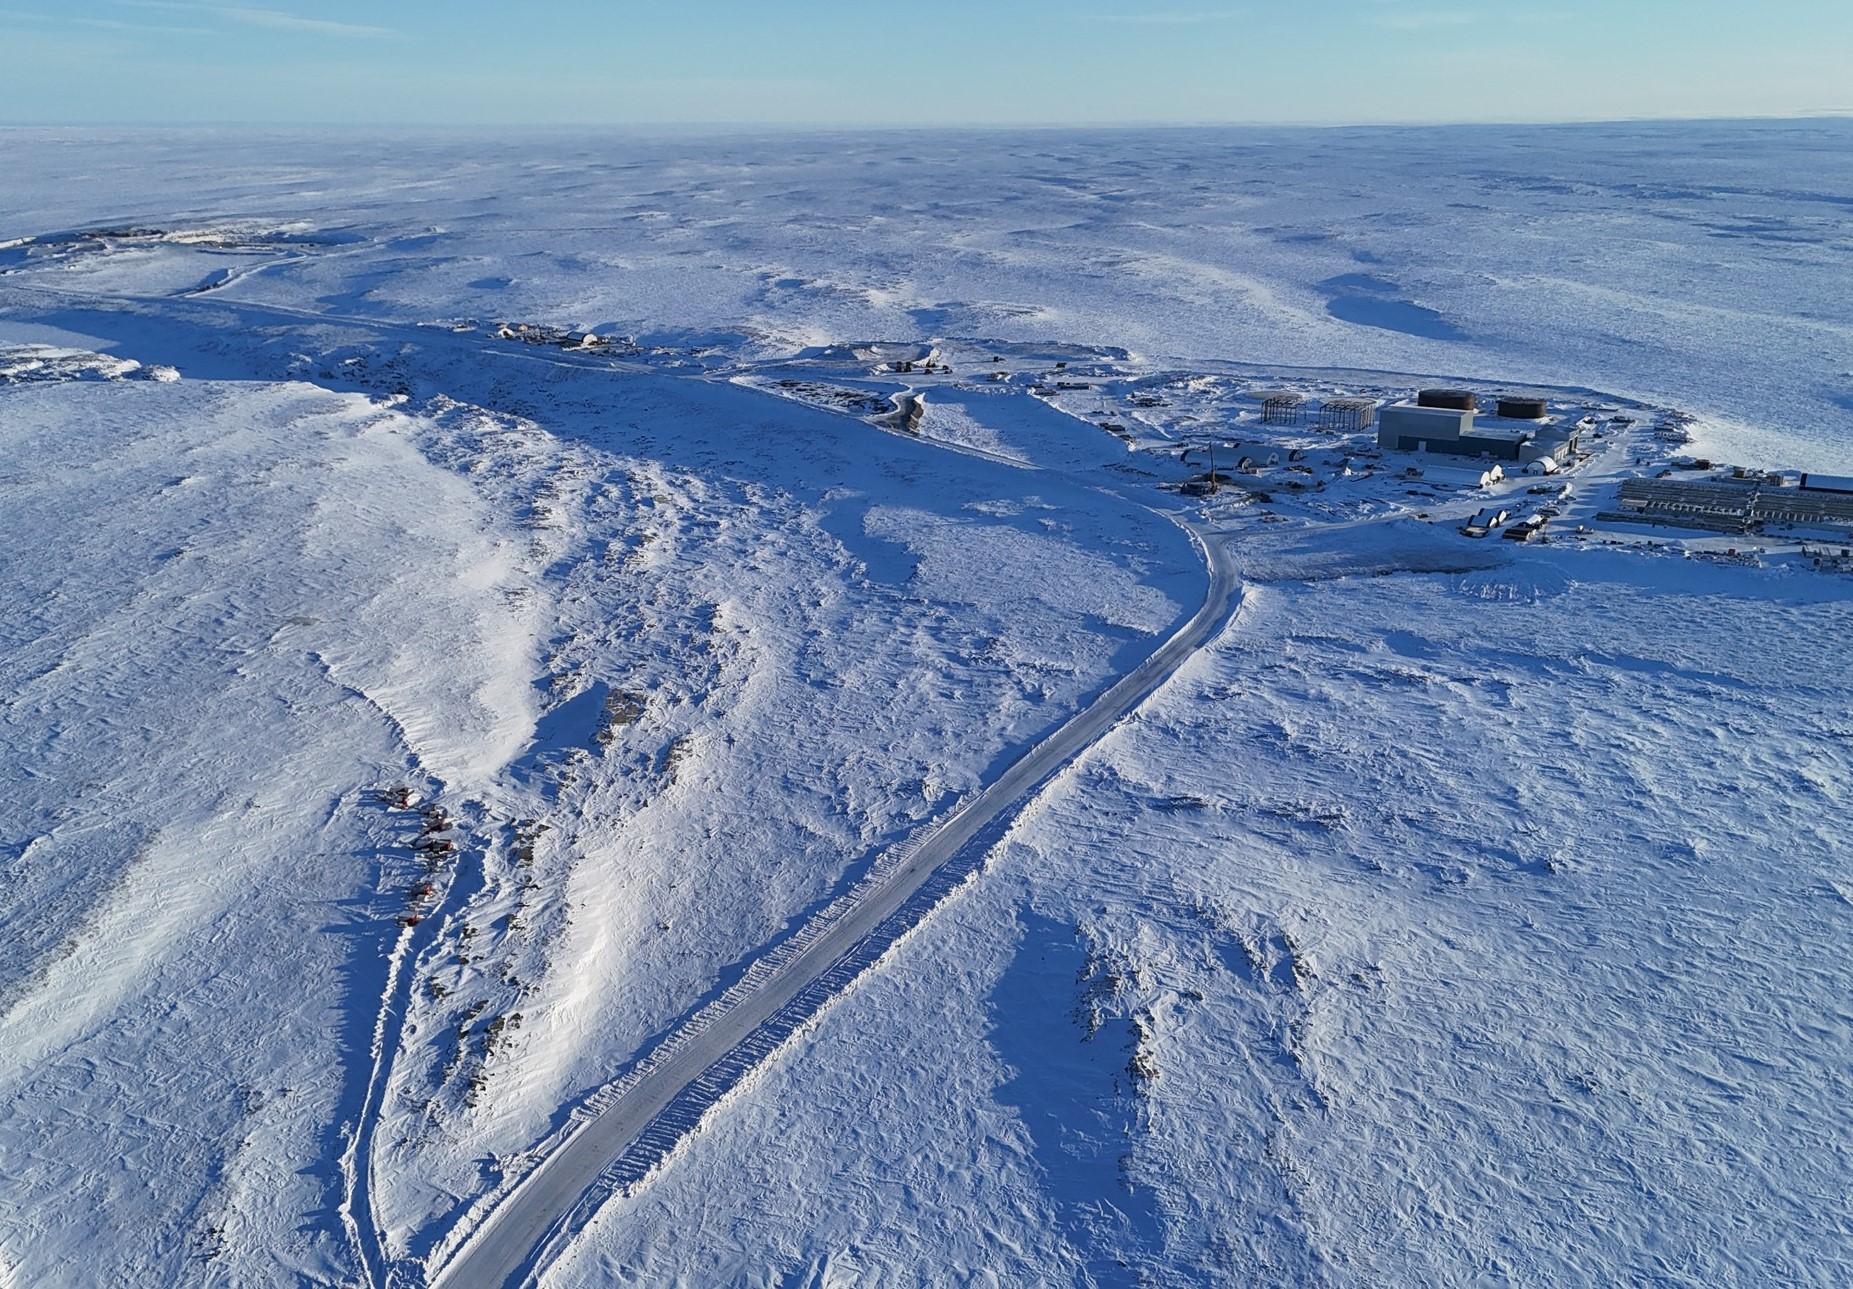
Goose Project accommodation complex overview – April 2024
B2Gold is expanding the existing diesel storage tank farms at the MLA and at the Goose Project site from 25 million liter capacity to more than 80 million liters. This increase requires the addition of three more tanks at each site. All the steel required to complete the tank expansion is present at each site, and construction crews have commenced assembling the tank bases. These tanks will be complete by the end of August 2024 to receive the sealift shipment of fuel that will sustain the project through the end of construction and into production in 2025.
The mill construction remains on schedule (with certain items ahead of schedule) with work ongoing on various facilities related to concrete, steel erection and building cladding. Installation of the ball mill is progressing ahead of schedule with the installation of all shell sections, feed/discharge heads, trunnion, pinion and bearings having been completed.
The primary pond will provide contact water storage as well as store reclaimed water during the first year of processing operations. It is critical for the primary pond to receive water in 2024 for mill start-up and commissioning. The facility embankment includes a frozen core that requires a below grade cut-off trench to be constructed during the winter months. The cut-off trench was successfully completed in April 2024. Phase 2 of the embankment will be completed during summer 2024.
Development of the open pit and underground is slightly behind schedule due to equipment availability (commissioning and availability of the open pit equipment), adverse weather conditions and prioritization of critical path construction activities. The current schedule indicates that an additional three months of mining must be added to the schedule to ensure that the Umwelt open pit, underground development, and crown pillar activities align and that there is sufficient tailings storage capacity in the Echo open pit. With the schedule change, the mill is now scheduled to produce first gold in the second quarter of 2025 with ramp up to full production in the third quarter of 2025 (one quarter later than previous estimates). This does not impact the other facets of the project and staffing tables have been adjusted to ensure that capital is conserved. With the updated schedule, the Company estimates that gold production in calendar year 2025 will be between 120,000 ounces and 150,000 ounces (previously estimated to be between 220,000 ounces and 260,000 ounces). The reduction in estimated gold production in 2025 is predominantly due to the deferral of an anticipated 100,000 ounces of quarterly gold production from the fourth quarter of 2025 into the first quarter of 2026. Importantly, the updated mining schedule does not impact the total number of gold ounces the Company expects to produce over the life of mine of the Goose Project. The updated production profile has resulted in the Company now estimating that average annual gold production from 2026 to 2030 will increase to be in excess of 310,000 ounces per year (previously estimated at 300,000 ounces per year).
After completing a detailed design review of the Goose Project, B2Gold announced in January 2024 a revised construction capital estimate to C$1,050 million. In addition, before first gold production the Company estimated it will spend an additional C$200 million on underground development, deferred stripping and sustaining capital, as well as an additional C$205 million for fuels, reagents, and other working capital items necessary to build up site inventory levels due to the seasonality of the project logistics. As of December 31, 2023, approximately C$683 million had been spent on construction and mine development activities and C$44 million for the build-up of supplies inventory. In the first quarter of 2024, the Company incurred $117 million (C$158 million) for the Goose Project on construction and mine development activities and $2 million (C$3 million) on supplies inventory. As at March 31, 2024, approximately C$841 million in cash expenditures had been spent on construction and mine development activities and C$47 million on supplies inventory. Given the activities completed through March 31, 2024, the incorporation of the new mining schedule, and the successful completion of the 2024 WIR campaign, the Company is in the process of completing a new review of the total cost to be incurred before first gold production. The updated total cost estimate is anticipated to be completed in June 2024. As a result of construction activities being on schedule (and in certain areas ahead of schedule), and the updated first gold production estimate relating solely to the mining schedule change, the Company estimates that the total spend to be incurred before first gold production will not be significantly different than previous estimates.
Fekola Complex Development
Based on B2Gold's preliminary planning, the Anaconda Area could provide selective higher grade saprolite material (average annual grade of up to 2.2 g/t gold) to be trucked approximately 20 km and fed into the Fekola mill at a rate of up to 1.5 million tonnes per annum. Trucking of selective higher grade saprolite material from the Anaconda Area to the Fekola mill will increase the ore processed and has the potential to generate approximately 80,000 to 100,000 ounces of initial gold production per year from Fekola Regional sources. Receipt of a mining permit for the Fekola Regional licenses remains outstanding pending finalization of an implementation decree for the new 2023 Mining Code by the State of Mali. As a result, no production is forecast from Fekola Regional in 2024, with production now expected to commence at the beginning of 2025. In early 2024, B2Gold held meetings with the representatives of the Government of Mali regarding the 2023 Mining Code. The Government of Mali assisted the Company in clarifying the application of the 2023 Mining Code to existing and future projects in Mali, and also expressed their desire for B2Gold to rapidly progress the development of Fekola Regional and committed to assisting the Company in such development. Importantly, the haul road from Fekola Regional to the Fekola Mine is operational as construction of the haul roads and mining infrastructure (warehouse, workshop, fuel depot and offices) was completed on schedule in 2023.
Gramalote Project Development
B2Gold's in-house projects team is progressing work on various smaller scale project development plans for the Gramalote Project, with the goal of identifying a higher-return project than the previously contemplated joint venture development plan. Based on the results of the 2022 Gramalote feasibility study, the contemplated larger scale project did not meet the combined investment return thresholds for development by both B2Gold and AngloGold Ashanti Limited. In 2023, B2Gold completed a detailed review of the Gramalote Project, including the facility size and location, power supply, mining and processing options, tailings design, resettlement, potential construction sequencing and camp design to identify potential cost savings to develop a smaller scale project. The results of the review allowed the Company to determine the optimal parameters and assumptions for a formal study, which commenced in the fourth quarter of 2023, with a PEA expected to be complete by the end of the second quarter of 2024.
Outlook
Based on the positive first quarter of 2024 operating and financial results, B2Gold is on track to meet its annual gold production forecast of between 860,000 and 940,000 ounces (including 40,000 to 50,000 attributable ounces from Calibre). The Company's total consolidated gold production is expected to be relatively consistent throughout 2024, with third quarter production expected to be slightly lower. The expected decrease in gold production relative to 2023 is predominantly due to lower production at the Fekola Complex as a result of the delay in receiving an exploitation license for Fekola Regional from the Government of Mali, delaying the 80,000 to 100,000 ounces that were scheduled in the life of mine plan to be trucked to the Fekola mill and processed in 2024. The contribution of this gold production from Fekola Regional is now expected to start at the beginning of 2025. The Company's total consolidated cash operating costs for the year (including estimated attributable results for Calibre) are forecast to be between $835 and $895 per ounce and total consolidated all-in sustaining costs (including estimated attributable results for Calibre) are forecast to be between $1,360 and 1,420 per ounce. The anticipated increase in the Company's consolidated cash operating costs per ounce for 2024 reflects the processing of lower-grade ore at Fekola in 2024. The total all-in sustaining costs per ounce for 2024 reflect the final full year of spending on both the new Fekola tailings storage facility and the Fekola solar plant expansion, in addition to the ongoing substantial capitalized stripping campaign planned at Fekola for 2024.
B2Gold has successfully completed the 2024 WIR campaign and has delivered all necessary material from the MLA to complete the construction of the Goose Project in the first quarter of 2025. The mill construction remains on schedule (and in some cases ahead of schedule) with work ongoing on various facilities related to concrete, steel erection and building cladding. Additionally, installation of the ball mill is progressing ahead of schedule with installation of all shell sections, feed/discharge heads, trunnion, pinion and bearings having been completed. Development of the open pit and underground is slightly behind schedule due to equipment availability (commissioning and availability of the open pit equipment), adverse weather conditions and prioritization of critical path construction activities. The current schedule indicates that an additional three months of mining will be added to the schedule to ensure that the Umwelt open pit, underground development, and crown pillar activities align and that there is sufficient tailings storage capacity in the Echo open pit. With the schedule change, the mill is now scheduled to produce first gold in the second quarter of 2025 with ramp up to full production in the third quarter of 2025 (one quarter later than previous estimates). Importantly, the updated mining schedule does not impact the total number of gold ounces the Company expects to produce over the life of mine of the Goose Project. The updated production profile has resulted in the Company now estimating that average annual gold production from 2026 to 2030 will increase to be in excess of 310,000 ounces per year (previously estimated at 300,000 ounces per year).
The Company has completed a detailed review of the Gramalote Project, including facility size and location, power supply, mining and processing options, tailings design, resettlement, potential construction sequencing and camp design to identify potential cost savings to develop a smaller scale project. A formal study commenced in the fourth quarter of 2023, with a PEA expected to be completed by the end of the second quarter of 2024.
B2Gold expects to declare future quarterly dividends in 2024 at the same rate of $0.04 per common share (or an annualized rate of $0.16 per common share), which represents one of the highest dividend yields in the gold sector. As of March 31, 2024, the expected annual dividend rate represented an approximate 6.1% yield.
The Company's ongoing strategy is to continue to maximize profitable production from its mines, further advance its pipeline of remaining development and exploration projects, evaluate new exploration, development and production opportunities and continue to pay an industry leading dividend yield.
First Quarter 2024 Financial Results - Conference Call Details
B2Gold executives will host a conference call to discuss the results on Wednesday, May 8, 2024, at 8:00 am PT / 11:00 am ET.
Participants may register for the conference call here: registration link. Upon registering, participants will receive a calendar invitation by email with dial in details and a unique PIN. This will allow participants to bypass the operator queue and connect directly to the conference. Registration will remain open until the end of the conference call. Participants may also dial in using the numbers below:
- Toll-free in U.S. and Canada: +1 (844) 763-8274
- All other callers: +1 (647) 484-8814
The conference call will be available for playback for two weeks by dialing toll-free in the U.S. and Canada: +1 (855) 669-9658, replay access code 0771. All other callers: +1 (604) 674-8052, replay access code 0771.
About B2Gold
B2Gold is a low-cost international senior gold producer headquartered in Vancouver, Canada. Founded in 2007, today, B2Gold has operating gold mines in Mali, Namibia and the Philippines, a mine under construction in northern Canada and numerous development and exploration projects in various countries including Mali, Colombia and Finland. B2Gold forecasts total consolidated gold production of between 860,000 and 940,000 ounces in 2024.
Qualified Persons
Bill Lytle, Senior Vice President and Chief Operating Officer, a qualified person under NI 43-101, has approved the scientific and technical information related to operations matters contained in this news release.
Andrew Brown, P. Geo., Vice President, Exploration, a qualified person under NI 43-101, has approved the scientific and technical information related to exploration and mineral resource matters contained in this news release.
ON BEHALF OF B2GOLD CORP.
“Clive T. Johnson”
President and Chief Executive Officer
The Toronto Stock Exchange and NYSE American LLC neither approve nor disapprove the information contained in this news release.
Production results and production guidance presented in this news release reflect total production at the mines B2Gold operates on a 100% project basis. Please see our Annual Information Form dated March 14, 2024, for a discussion of our ownership interest in the mines B2Gold operates.
This news release includes certain "forward-looking information" and "forward-looking statements" (collectively "forward-looking statements") within the meaning of applicable Canadian and United States securities legislation, including: projections; outlook; guidance; forecasts; estimates; and other statements regarding future or estimated financial and operational performance, gold production and sales, revenues and cash flows, and capital costs (sustaining and non-sustaining) and operating costs, including projected cash operating costs and AISC, and budgets on a consolidated and mine by mine basis; future or estimated mine life, metal price assumptions, ore grades or sources, gold recovery rates, stripping ratios, throughput, ore processing; statements regarding anticipated exploration, drilling, development, construction, permitting and other activities or achievements of B2Gold; and including, without limitation: remaining well positioned for continued strong operational and financial performance in 2024; projected gold production, cash operating costs and AISC on a consolidated and mine by mine basis in 2024; total consolidated gold production of between 860,000 and 940,000 ounces (including 40,000 to 50,000 attributable ounces from Calibre) in 2024, with cash operating costs of between $835 and $895 per ounce and AISC of between $1,360 and $1,420 per ounce; B2Gold's continued prioritization of developing the Goose Project in a manner that recognizes Indigenous input and concerns and brings long-term socio-economic benefits to the area; the Goose Project capital cost being approximately C$1,050 million and the net cost of open pit and underground development, deferred stripping, and sustaining capital expenditures to be incurred prior to first gold production being approximately C$200 million and the cost for reagents and other working capital items being C$205 million; the Goose Project producing approximately 310,000 ounces of gold per year for the first five years; the potential for completion of the mill construction in the first quarter of 2025 and first gold production in the second quarter of 2025 from the Goose Project; the Company's consolidated gold production to be relatively consistent throughout 2024; Fekola Regional production now expected to commence at the beginning of 2025; the potential receipt of a mining permit for Fekola Regional licenses later in 2024; the impact of the 2023 Mining Code in Mali; the potential for the Antelope deposit to be developed as an underground operation and contribute gold during the low-grade stockpile processing in 2026 through 2031; the timing and results of a PEA for the Gramalote Project; and B2Gold's attributable share of Calibre's production. All statements in this news release that address events or developments that we expect to occur in the future are forward-looking statements. Forward-looking statements are statements that are not historical facts and are generally, although not always, identified by words such as "expect", "plan", "anticipate", "project", "target", "potential", "schedule", "forecast", "budget", "estimate", "intend" or "believe" and similar expressions or their negative connotations, or that events or conditions "will", "would", "may", "could", "should" or "might" occur. All such forward-looking statements are based on the opinions and estimates of management as of the date such statements are made.
Forward-looking statements necessarily involve assumptions, risks and uncertainties, certain of which are beyond B2Gold's control, including risks associated with or related to: the volatility of metal prices and B2Gold's common shares; changes in tax laws; the dangers inherent in exploration, development and mining activities; the uncertainty of reserve and resource estimates; not achieving production, cost or other estimates; actual production, development plans and costs differing materially from the estimates in B2Gold's feasibility and other studies; the ability to obtain and maintain any necessary permits, consents or authorizations required for mining activities; environmental regulations or hazards and compliance with complex regulations associated with mining activities; climate change and climate change regulations; the ability to replace mineral reserves and identify acquisition opportunities; the unknown liabilities of companies acquired by B2Gold; the ability to successfully integrate new acquisitions; fluctuations in exchange rates; the availability of financing; financing and debt activities, including potential restrictions imposed on B2Gold's operations as a result thereof and the ability to generate sufficient cash flows; operations in foreign and developing countries and the compliance with foreign laws, including those associated with operations in Mali, Namibia, the Philippines and Colombia and including risks related to changes in foreign laws and changing policies related to mining and local ownership requirements or resource nationalization generally; remote operations and the availability of adequate infrastructure; fluctuations in price and availability of energy and other inputs necessary for mining operations; shortages or cost increases in necessary equipment, supplies and labour; regulatory, political and country risks, including local instability or acts of terrorism and the effects thereof; the reliance upon contractors, third parties and joint venture partners; the lack of sole decision-making authority related to Filminera Resources Corporation, which owns the Masbate Project; challenges to title or surface rights; the dependence on key personnel and the ability to attract and retain skilled personnel; the risk of an uninsurable or uninsured loss; adverse climate and weather conditions; litigation risk; competition with other mining companies; community support for B2Gold's operations, including risks related to strikes and the halting of such operations from time to time; conflicts with small scale miners; failures of information systems or information security threats; the ability to maintain adequate internal controls over financial reporting as required by law, including Section 404 of the Sarbanes-Oxley Act; compliance with anti-corruption laws, and sanctions or other similar measures; social media and B2Gold's reputation; risks affecting Calibre having an impact on the value of the Company's investment in Calibre, and potential dilution of our equity interest in Calibre; as well as other factors identified and as described in more detail under the heading "Risk Factors" in B2Gold's most recent Annual Information Form, B2Gold's current Form 40-F Annual Report and B2Gold's other filings with Canadian securities regulators and the U.S. Securities and Exchange Commission (the "SEC"), which may be viewed at www.sedar.com and www.sec.gov, respectively (the "Websites"). The list is not exhaustive of the factors that may affect B2Gold's forward-looking statements.
B2Gold's forward-looking statements are based on the applicable assumptions and factors management considers reasonable as of the date hereof, based on the information available to management at such time. These assumptions and factors include, but are not limited to, assumptions and factors related to B2Gold's ability to carry on current and future operations, including: development and exploration activities; the timing, extent, duration and economic viability of such operations, including any mineral resources or reserves identified thereby; the accuracy and reliability of estimates, projections, forecasts, studies and assessments; B2Gold's ability to meet or achieve estimates, projections and forecasts; the availability and cost of inputs; the price and market for outputs, including gold; foreign exchange rates; taxation levels; the timely receipt of necessary approvals or permits; the ability to meet current and future obligations; the ability to obtain timely financing on reasonable terms when required; the current and future social, economic and political conditions; and other assumptions and factors generally associated with the mining industry.
B2Gold's forward-looking statements are based on the opinions and estimates of management and reflect their current expectations regarding future events and operating performance and speak only as of the date hereof. B2Gold does not assume any obligation to update forward-looking statements if circumstances or management's beliefs, expectations or opinions should change other than as required by applicable law. There can be no assurance that forward-looking statements will prove to be accurate, and actual results, performance or achievements could differ materially from those expressed in, or implied by, these forward-looking statements. Accordingly, no assurance can be given that any events anticipated by the forward-looking statements will transpire or occur, or if any of them do, what benefits or liabilities B2Gold will derive therefrom. For the reasons set forth above, undue reliance should not be placed on forward-looking statements.
Non-IFRS Measures
This news release includes certain terms or performance measures commonly used in the mining industry that are not defined under International Financial Reporting Standards ("IFRS"), including "cash operating costs" and "all-in sustaining costs" (or "AISC"). Non-IFRS measures do not have any standardized meaning prescribed under IFRS, and therefore they may not be comparable to similar measures employed by other companies. The data presented is intended to provide additional information and should not be considered in isolation or as a substitute for measures of performance prepared in accordance with IFRS and should be read in conjunction with B2Gold's consolidated financial statements. Readers should refer to B2Gold's Management Discussion and Analysis, available on the Websites, under the heading "Non-IFRS Measures" for a more detailed discussion of how B2Gold calculates certain of such measures and a reconciliation of certain measures to IFRS terms.
Cautionary Statement Regarding Mineral Reserve and Resource Estimates
The disclosure in this news release was prepared in accordance with Canadian National Instrument 43-101, which differs significantly from the requirements of the United States Securities and Exchange Commission ("SEC"), and resource and reserve information contained or referenced in this news release may not be comparable to similar information disclosed by public companies subject to the technical disclosure requirements of the SEC. Historical results or feasibility models presented herein are not guarantees or expectations of future performance.
B2GOLD CORP.
CONDENSED INTERIM CONSOLIDATED STATEMENTS OF OPERATIONS
FOR THE THREE MONTHS ENDED MARCH 31
(Expressed in thousands of United States dollars, except per share amounts)
(Unaudited)
| 2024 | 2023 | ||||||
| Gold revenue | $ | 461,444 | $ | 473,556 | |||
| Cost of sales | |||||||
| Production costs | (156,745 | ) | (127,604 | ) | |||
| Depreciation and depletion | (90,446 | ) | (97,158 | ) | |||
| Royalties and production taxes | (30,027 | ) | (35,161 | ) | |||
| Total cost of sales | (277,218 | ) | (259,923 | ) | |||
| Gross profit | 184,226 | 213,633 | |||||
| General and administrative | (14,138 | ) | (14,185 | ) | |||
| Share-based payments | (4,954 | ) | (6,854 | ) | |||
| Non-recoverable input taxes | (4,304 | ) | (1,907 | ) | |||
| Share of net income of associates | 2,097 | 4,979 | |||||
| Foreign exchange losses | (2,379 | ) | (596 | ) | |||
| Community relations | (489 | ) | (1,003 | ) | |||
| Write-down of mining interests | — | (16,457 | ) | ||||
| Other expense | (5,432 | ) | (1,691 | ) | |||
| Operating income | 154,627 | 175,919 | |||||
| Interest and financing expense | (9,571 | ) | (2,926 | ) | |||
| Interest income | 5,455 | 5,819 | |||||
| Change in fair value of gold stream | (10,852 | ) | — | ||||
| Dilution loss on associate | (9,982 | ) | — | ||||
| Gains (losses) on derivative instruments | 275 | (357 | ) | ||||
| Other income (expense) | 143 | (1,600 | ) | ||||
| Income from operations before taxes | 130,095 | 176,855 | |||||
| Current income tax, withholding and other taxes | (61,584 | ) | (76,740 | ) | |||
| Deferred income tax (expense) recovery | (20,030 | ) | 1,789 | ||||
| Net income for the period | $ | 48,481 | $ | 101,904 | |||
| Attributable to: | |||||||
| Shareholders of the Company | $ | 39,751 | $ | 85,973 | |||
| Non-controlling interests | 8,730 | 15,931 | |||||
| Net income for the period | $ | 48,481 | $ | 101,904 | |||
| Earnings per share (attributable to shareholders of the Company) | |||||||
| Basic | $ | 0.03 | $ | 0.08 | |||
| Diluted | $ | 0.03 | $ | 0.08 | |||
| Weighted average number of common shares outstanding (in thousands) | |||||||
| Basic | 1,303,191 | 1,075,402 | |||||
| Diluted | 1,307,674 | 1,081,084 | |||||
B2GOLD CORP.
CONDENSED INTERIM CONSOLIDATED STATEMENTS OF CASH FLOWS
FOR THE THREE MONTHS ENDED MARCH 31
(Expressed in thousands of United States dollars)
(Unaudited)
| 2024 | 2023 | ||||||
| Operating activities | |||||||
| Net income for the period | $ | 48,481 | $ | 101,904 | |||
| Mine restoration provisions settled | (291 | ) | — | ||||
| Non-cash charges, net | 151,322 | 121,532 | |||||
| Proceeds from prepaid sales | 500,023 | — | |||||
| Changes in non-cash working capital | 21,985 | 6,226 | |||||
| Changes in long-term supplies inventory | 4,152 | — | |||||
| Changes in long-term value added tax receivables | (14,945 | ) | (25,839 | ) | |||
| Cash provided by operating activities | 710,727 | 203,823 | |||||
| Financing activities | |||||||
| Repayment of revolving credit facility | (150,000 | ) | — | ||||
| Repayment of equipment loan facilities | (2,387 | ) | (3,578 | ) | |||
| Interest and commitment fees paid | (3,579 | ) | (1,002 | ) | |||
| Cash proceeds from stock option exercises | 1,088 | 2,444 | |||||
| Dividends paid | (45,989 | ) | (42,976 | ) | |||
| Principal payments on lease arrangements | (1,448 | ) | (1,443 | ) | |||
| Distributions to non-controlling interests | (4,580 | ) | (2,082 | ) | |||
| Other | 271 | 817 | |||||
| Cash used by financing activities | (206,624 | ) | (47,820 | ) | |||
| Investing activities | |||||||
| Expenditures on mining interests: | |||||||
| Fekola Mine | (80,562 | ) | (53,795 | ) | |||
| Masbate Mine | (8,530 | ) | (8,953 | ) | |||
| Otjikoto Mine | (13,813 | ) | (17,346 | ) | |||
| Goose Project | (117,451 | ) | — | ||||
| Fekola Regional Properties | (4,501 | ) | (14,775 | ) | |||
| Gramalote Project | (3,310 | ) | (510 | ) | |||
| Other exploration | (8,840 | ) | (15,991 | ) | |||
| Loan to associate | (1,496 | ) | — | ||||
| Funding of reclamation accounts | (1,029 | ) | (1,289 | ) | |||
| Purchase of long-term investment | — | (15,116 | ) | ||||
| Cash paid for purchase of non-controlling interest | — | (6,704 | ) | ||||
| Deferred consideration received | — | 3,850 | |||||
| Other | (45 | ) | (459 | ) | |||
| Cash used by investing activities | (239,577 | ) | (131,088 | ) | |||
| Increase in cash and cash equivalents | 264,526 | 24,915 | |||||
| Effect of exchange rate changes on cash and cash equivalents | (3,607 | ) | (3,121 | ) | |||
| Cash and cash equivalents, beginning of period | 306,895 | 651,946 | |||||
| Cash and cash equivalents, end of period | $ | 567,814 | $ | 673,740 | |||
B2GOLD CORP.
CONDENSED INTERIM CONSOLIDATED BALANCE SHEETS
(Expressed in thousands of United States dollars)
(Unaudited)
| As at March 31, 2024 | As at December 31, 2023 | ||||||
| Assets | |||||||
| Current | |||||||
| Cash and cash equivalents | $ | 567,814 | $ | 306,895 | |||
| Accounts receivable, prepaids and other | 26,087 | 27,491 | |||||
| Value-added and other tax receivables | 29,046 | 29,848 | |||||
| Inventories | 339,351 | 346,495 | |||||
| Assets classified as held for sale | 34,347 | — | |||||
| 996,645 | 710,729 | ||||||
| Long-term investments | 101,497 | 86,007 | |||||
| Value-added tax receivables | 216,663 | 199,671 | |||||
| Mining interests | 3,682,923 | 3,563,490 | |||||
| Investment in associates | 126,207 | 134,092 | |||||
| Long-term stockpile | 58,941 | 56,497 | |||||
| Long-term supplies inventory | 33,259 | 43,571 | |||||
| Other assets | 71,865 | 63,635 | |||||
| Deferred income taxes | 8,272 | 16,927 | |||||
| $ | 5,296,272 | $ | 4,874,619 | ||||
| Liabilities | |||||||
| Current | |||||||
| Accounts payable and accrued liabilities | $ | 175,892 | $ | 167,117 | |||
| Current income and other taxes payable | 132,418 | 120,679 | |||||
| Current portion of long-term debt | 16,414 | 16,256 | |||||
| Current portion of mine restoration provisions | 2,759 | 3,050 | |||||
| Other current liabilities | 6,157 | 6,369 | |||||
| 333,640 | 313,471 | ||||||
| Long-term debt | 28,804 | 175,869 | |||||
| Gold stream obligation | 150,452 | 139,600 | |||||
| Prepaid gold sales | 507,640 | — | |||||
| Mine restoration provisions | 101,570 | 104,607 | |||||
| Deferred income taxes | 200,004 | 188,106 | |||||
| Employee benefits obligation | 19,916 | 19,171 | |||||
| Other long-term liabilities | 24,390 | 23,820 | |||||
| 1,366,416 | 964,644 | ||||||
| Equity | |||||||
| Shareholders’ equity | |||||||
| Share capital | 3,463,392 | 3,454,811 | |||||
| Contributed surplus | 88,745 | 84,970 | |||||
| Accumulated other comprehensive loss | (110,285 | ) | (125,256 | ) | |||
| Retained earnings | 384,539 | 395,854 | |||||
| 3,826,391 | 3,810,379 | ||||||
| Non-controlling interests | 103,465 | 99,596 | |||||
| 3,929,856 | 3,909,975 | ||||||
| $ | 5,296,272 | $ | 4,874,619 | ||||
NON-IFRS MEASURES
Cash operating costs per gold ounce sold and total cash costs per gold ounce sold
‘‘Cash operating costs per gold ounce’’ and “total cash costs per gold ounce” are common financial performance measures in the gold mining industry but, as non-IFRS measures, they do not have a standardized meaning under IFRS and therefore may not be comparable to similar measures presented by other issuers. Management believes that, in addition to conventional measures prepared in accordance with IFRS, certain investors use this information to evaluate our performance and ability to generate cash flow. Accordingly, these measures are intended to provide additional information and should not be considered in isolation or as a substitute for measures of performance prepared in accordance with IFRS. The measures, along with sales, are considered to be a key indicator of the Company’s ability to generate earnings and cash flow from its mining operations.
Cash cost figures are calculated on a sales basis in accordance with a standard developed by The Gold Institute, which was a worldwide association of suppliers of gold and gold products and included leading North American gold producers. The Gold Institute ceased operations in 2002, but the standard is the accepted standard of reporting cash cost of production in North America. Adoption of the standard is voluntary and the cost measures presented may not be comparable to other similarly titled measures of other companies. Other companies may calculate these measures differently. Cash operating costs and total cash costs per gold ounce sold are derived from amounts included in the statement of operations and include mine site operating costs such as mining, processing, smelting, refining, transportation costs, royalties and production taxes, less silver by-product credits. The tables below show a reconciliation of cash operating costs per gold ounce sold and total cash costs per gold ounce sold to production costs as extracted from the unaudited condensed interim consolidated financial statements on a consolidated and a mine-by-mine basis (dollars in thousands):
| For the three months ended March 31, 2024 | ||||||
| Fekola Mine | Masbate Mine | Otjikoto Mine | Total | Calibre equity investment | Grand Total | |
| $ | $ | $ | $ | $ | $ | |
| Production costs | 85,105 | 42,771 | 28,869 | 156,745 | 11,905 | 168,650 |
| Royalties and production taxes | 20,395 | 5,390 | 4,242 | 30,027 | 854 | 30,881 |
| Total cash costs | 105,500 | 48,161 | 33,111 | 186,772 | 12,759 | 199,531 |
| Gold sold (ounces) | 123,828 | 47,700 | 51,450 | 222,978 | 11,377 | 234,355 |
| Cash operating costs per ounce ($/ gold ounce sold) | 687 | 897 | 561 | 703 | 1,046 | 720 |
| Total cash costs per ounce ($/ gold ounce sold) | 852 | 1,010 | 644 | 838 | 1,121 | 851 |
| For the three months ended March 31, 2023 | ||||||
| Fekola Mine | Masbate Mine | Otjikoto Mine | Total | Calibre equity investment | Grand Total | |
| $ | $ | $ | $ | $ | $ | |
| Production costs | 77,661 | 24,993 | 24,950 | 127,604 | 15,765 | 143,369 |
| Royalties and production taxes | 26,666 | 4,413 | 4,082 | 35,161 | 1,254 | 36,415 |
| Total cash costs | 104,327 | 29,406 | 29,032 | 162,765 | 17,019 | 179,784 |
| Gold sold (ounces) | 165,050 | 29,650 | 54,450 | 249,150 | 16,142 | 265,292 |
| Cash operating costs per ounce ($/ gold ounce sold) | 471 | 843 | 458 | 512 | 977 | 540 |
| Total cash costs per ounce ($/ gold ounce sold) | 632 | 992 | 533 | 653 | 1,054 | 678 |
Cash operating costs per gold ounce produced
In addition to cash operating costs on a per gold ounce sold basis, the Company also presents cash operating costs on a per gold ounce produced basis. Cash operating costs per gold ounce produced is derived from amounts included in the statement of operations and include mine site operating costs such as mining, processing, smelting, refining, transportation costs, less silver by-product credits. The tables below show a reconciliation of cash operating costs per gold ounce produced to production costs as extracted from the unaudited condensed interim consolidated financial statements on a consolidated and a mine-by-mine basis (dollars in thousands):
| For the three months ended March 31, 2024 | ||||||||||
| Fekola Mine | Masbate Mine | Otjikoto Mine | Total | Calibre equity investment | Grand Total | |||||
| $ | $ | $ | $ | $ | $ | |||||
| Production costs | 85,105 | 42,771 | 28,869 | 156,745 | 11,905 | 168,650 | ||||
| Inventory sales adjustment | (1,922 | ) | (1,224 | ) | 272 | (2,874 | ) | — | (2,874 | ) |
| Cash operating costs | 83,183 | 41,547 | 29,141 | 153,871 | 11,905 | 165,776 | ||||
| Gold produced (ounces) | 119,141 | 49,782 | 45,416 | 214,339 | 11,377 | 225,716 | ||||
| Cash operating costs per ounce ($/ gold ounce produced) | 698 | 835 | 642 | 718 | 1,046 | 734 | ||||
| For the three months ended March 31, 2023 | |||||||
| Fekola Mine | Masbate Mine | Otjikoto Mine | Total | Calibre equity investment | Grand Total | ||
| $ | $ | $ | $ | $ | $ | ||
| Production costs | 77,661 | 24,993 | 24,950 | 127,604 | 15,765 | 143,369 | |
| Inventory sales adjustment | 2,518 | 15,937 | (1,649 | ) | 16,806 | — | 16,806 |
| Cash operating costs | 80,179 | 40,930 | 23,301 | 144,410 | 15,765 | 160,175 | |
| Gold produced (ounces) | 165,864 | 46,364 | 38,491 | 250,719 | 16,137 | 266,856 | |
| Cash operating costs per ounce ($/ gold ounce produced) | 483 | 883 | 605 | 576 | 977 | 600 | |
All-in sustaining costs per gold ounce
In June 2013, the World Gold Council, a non-regulatory association of the world’s leading gold mining companies established to promote the use of gold to industry, consumers and investors, provided guidance for the calculation of the measure “all-in sustaining costs per gold ounce”, but as a non-IFRS measure, it does not have a standardized meaning under IFRS and therefore may not be comparable to similar measures presented by other issuers. The original World Gold Council standard became effective January 1, 2014 with further updates announced on November 16, 2018 which were effective starting January 1, 2019.
Management believes that the all-in sustaining costs per gold ounce measure provides additional insight into the costs of producing gold by capturing all of the expenditures required for the discovery, development and sustaining of gold production and allows the Company to assess its ability to support capital expenditures to sustain future production from the generation of operating cash flows. Management believes that, in addition to conventional measures prepared in accordance with IFRS, certain investors use this information to evaluate the Company's performance and ability to generate cash flow. Accordingly, it is intended to provide additional information and should not be considered in isolation or as a substitute for measures of performance prepared in accordance with IFRS. Adoption of the standard is voluntary and the cost measures presented may not be comparable to other similarly titled measures of other companies. The Company has applied the principles of the World Gold Council recommendations and has reported all-in sustaining costs on a sales basis. Other companies may calculate these measures differently.
B2Gold defines all-in sustaining costs per ounce as the sum of cash operating costs, royalties and production taxes, capital expenditures and exploration costs that are sustaining in nature, sustaining lease expenditures, corporate general and administrative costs, share-based payment expenses related to restricted share units/deferred share units/performance share units/restricted phantom units ("RSUs/DSUs/PSUs/RPUs"), community relations expenditures, reclamation liability accretion and realized (gains) losses on fuel derivative contracts, all divided by the total gold ounces sold to arrive at a per ounce figure.
The tables below show a reconciliation of all-in sustaining costs per ounce to production costs as extracted from the unaudited condensed interim consolidated financial statements on a consolidated and a mine-by-mine basis for the three months ended March 31, 2024 (dollars in thousands):
| For the three months ended March 31, 2024 | ||||||||||||
| Fekola Mine | Masbate Mine | Otjikoto Mine | Corporate | Total | Calibre equity investment | Grand Total | ||||||
| $ | $ | $ | $ | $ | $ | $ | ||||||
| Production costs | 85,105 | 42,771 | 28,869 | — | 156,745 | 11,905 | 168,650 | |||||
| Royalties and production taxes | 20,395 | 5,390 | 4,242 | — | 30,027 | 854 | 30,881 | |||||
| Corporate administration | 2,727 | 514 | 1,480 | 9,417 | 14,138 | 561 | 14,699 | |||||
| Share-based payments – RSUs/DSUs/PSUs/RPUs(1) | 33 | — | — | 4,973 | 5,006 | — | 5,006 | |||||
| Community relations | 145 | 13 | 331 | — | 489 | — | 489 | |||||
| Reclamation liability accretion | 435 | 301 | 238 | — | 974 | — | 974 | |||||
| Realized gains on derivative contracts | (218 | ) | (144 | ) | (31 | ) | — | (393 | ) | — | (393 | ) |
| Sustaining lease expenditures | 84 | 318 | 554 | 492 | 1,448 | — | 1,448 | |||||
| Sustaining capital expenditures(2) | 67,870 | 8,249 | 12,898 | — | 89,017 | 1,755 | 90,772 | |||||
| Sustaining mine exploration(2) | 1,302 | 734 | 702 | — | 2,738 | — | 2,738 | |||||
| Total all-in sustaining costs | 177,878 | 58,146 | 49,283 | 14,882 | 300,189 | 15,075 | 315,264 | |||||
| Gold sold (ounces) | 123,828 | 47,700 | 51,450 | — | 222,978 | 11,377 | 234,355 | |||||
| All-in sustaining cost per ounce ($/ gold ounce sold) | 1,436 | 1,219 | 958 | — | 1,346 | 1,325 | 1,345 | |||||
(1) Included as a component of Share-based payments on the Statement of operations.
(2) Refer to Sustaining capital expenditures and Sustaining mine exploration reconciliations below.
The table below shows a reconciliation of sustaining capital expenditures to operating mine capital expenditures as extracted from the unaudited condensed interim consolidated financial statements for the three months ended March 31, 2024 (dollars in thousands):
| For the three months ended March 31, 2024 | |||||||||||
| Fekola Mine | Masbate Mine | Otjikoto Mine | Total | Calibre equity investment | Grand Total | ||||||
| $ | $ | $ | $ | $ | $ | ||||||
| Operating mine capital expenditures | 80,562 | 8,530 | 13,813 | 102,905 | 1,755 | 104,660 | |||||
| Fekola underground | (11,104 | ) | — | — | (11,104 | ) | — | (11,104 | ) | ||
| Road construction | (1,588 | ) | — | — | (1,588 | ) | — | (1,588 | ) | ||
| Land acquisition | — | (71 | ) | — | (71 | ) | — | (71 | ) | ||
| Other | — | (210 | ) | (915 | ) | (1,125 | ) | — | (1,125 | ) | |
| Sustaining capital expenditures | 67,870 | 8,249 | 12,898 | 89,017 | 1,755 | 90,772 | |||||
The table below shows a reconciliation of sustaining mine exploration to operating mine exploration as extracted from the unaudited condensed interim consolidated financial statements for the three months ended March 31, 2024 (dollars in thousands):
| For the three months ended March 31, 2024 | ||||||||||
| Fekola Mine | Masbate Mine | Otjikoto Mine | Total | Calibre equity investment | Grand Total | |||||
| $ | $ | $ | $ | $ | $ | |||||
| Operating mine exploration | 1,302 | 821 | 1,789 | 3,912 | — | 3,912 | ||||
| Regional exploration | — | (87 | ) | (1,087 | ) | (1,174 | ) | — | (1,174 | ) |
| Sustaining mine exploration | 1,302 | 734 | 702 | 2,738 | — | 2,738 | ||||
The tables below show a reconciliation of all-in sustaining costs per ounce to production costs as extracted from the unaudited condensed interim consolidated financial statements on a consolidated and a mine-by-mine basis for the three months ended March 31, 2023 (dollars in thousands):
| For the three months ended March 31, 2023 | ||||||||||||
| Fekola Mine | Masbate Mine | Otjikoto Mine | Corporate | Total | Calibre equity investment | Grand Total | ||||||
| $ | $ | $ | $ | $ | $ | $ | ||||||
| Production costs | 77,661 | 24,993 | 24,950 | — | 127,604 | 15,765 | 143,369 | |||||
| Royalties and production taxes | 26,666 | 4,413 | 4,082 | — | 35,161 | 1,254 | 36,415 | |||||
| Corporate administration | 2,961 | 499 | 1,704 | 9,021 | 14,185 | 749 | 14,934 | |||||
| Share-based payments – RSUs/DSUs/PSUs/RPUs(1) | — | — | — | 4,319 | 4,319 | — | 4,319 | |||||
| Community relations | 674 | 58 | 271 | — | 1,003 | — | 1,003 | |||||
| Reclamation liability accretion | 381 | 291 | 294 | — | 966 | — | 966 | |||||
| Realized gains on derivative contracts | (771 | ) | (1,172 | ) | (488 | ) | — | (2,431 | ) | — | (2,431 | ) |
| Sustaining lease expenditures | 64 | 307 | 623 | 449 | 1,443 | — | 1,443 | |||||
| Sustaining capital expenditures(2) | 49,776 | 8,776 | 17,346 | — | 75,898 | 2,006 | 77,904 | |||||
| Sustaining mine exploration(2) | 1,706 | 959 | 494 | — | 3,159 | — | 3,159 | |||||
| Total all-in sustaining costs | 159,118 | 39,124 | 49,276 | 13,789 | 261,307 | 19,774 | 281,081 | |||||
| Gold sold (ounces) | 165,050 | 29,650 | 54,450 | — | 249,150 | 16,142 | 265,292 | |||||
| All-in sustaining cost per ounce ($/ gold ounce sold) | 964 | 1,320 | 905 | — | 1,049 | 1,225 | 1,060 | |||||
(1) Included as a component of Share-based payments on the Statement of operations.
(2) Refer to Sustaining capital expenditures and Sustaining mine exploration reconciliations below
The table below shows a reconciliation of sustaining capital expenditures to operating mine capital expenditures as extracted from the unaudited condensed interim consolidated financial statements for the three months ended March 31, 2023 (dollars in thousands):
| For the three months ended March 31, 2023 | ||||||||||
| Fekola Mine | Masbate Mine | Otjikoto Mine | Total | Calibre equity investment | Grand Total | |||||
| $ | $ | $ | $ | $ | $ | |||||
| Operating mine capital expenditures | 53,795 | 8,953 | 17,346 | 80,094 | 2,006 | 82,100 | ||||
| Road construction | (2,410 | ) | — | — | (2,410 | ) | — | (2,410 | ) | |
| Fekola underground study | (1,609 | ) | — | — | (1,609 | ) | — | (1,609 | ) | |
| Other | — | (177 | ) | — | (177 | ) | — | (177 | ) | |
| Sustaining capital expenditures | 49,776 | 8,776 | 17,346 | 75,898 | 2,006 | 77,904 | ||||
The table below shows a reconciliation of sustaining mine exploration to operating mine exploration as extracted from the unaudited condensed interim consolidated financial statements for the three months ended March 31, 2023 (dollars in thousands):
| For the three months ended March 31, 2023 | ||||||
| Fekola Mine | Masbate Mine | Otjikoto Mine | Total | Calibre equity investment | Grand Total | |
| $ | $ | $ | $ | $ | $ | |
| Operating mine exploration | 1,706 | 959 | 494 | 3,159 | — | 3,159 |
| Regional exploration | — | — | — | — | — | — |
| Sustaining mine exploration | 1,706 | 959 | 494 | 3,159 | — | 3,159 |
Adjusted net income and adjusted earnings per share - basic
Adjusted net income and adjusted earnings per share – basic are non-IFRS measures that do not have a standardized meaning prescribed by IFRS and therefore may not be comparable to similar measures presented by other issuers. The Company defines adjusted net income as net income attributable to shareholders of the Company adjusted for non-recurring items and also significant recurring non-cash items. The Company defines adjusted earnings per share – basic as adjusted net income divided by the basic weighted number of common shares outstanding.
Management believes that the presentation of adjusted net income and adjusted earnings per share - basic is appropriate to provide additional information to investors regarding items that we do not expect to continue at the same level in the future or that management does not believe to be a reflection of the Company's ongoing operating performance. Management further believes that its presentation of these non-IFRS financial measures provide information that is useful to investors because they are important indicators of the strength of our operations and the performance of our core business. Accordingly, it is intended to provide additional information and should not be considered in isolation as a substitute for measures of performance prepared in accordance with IFRS. Other companies may calculate this measure differently.
A reconciliation of net income to adjusted net income as extracted from the unaudited condensed interim consolidated financial statements is set out in the table below:
| Three months ended | |||
| March 31, | |||
| 2024 | 2023 | ||
| $ | $ | ||
| (000’s) | (000’s) | ||
| Net income attributable to shareholders of the Company for the period: | 39,751 | 85,973 | |
| Adjustments for non-recurring and significant recurring non-cash items: | |||
| Write-down of mining interests | — | 16,419 | |
| Unrealized losses on derivative instruments | 118 | 2,788 | |
| Office lease termination costs | — | 1,946 | |
| Change in fair value of gold stream | 10,852 | — | |
| Dilution loss on investment in associate | 9,982 | — | |
| Deferred income tax expense (recovery) | 20,800 | (1,264 | ) |
| Adjusted net income attributable to shareholders of the Company for the period | 81,503 | 105,862 | |
| Basic weighted average number of common shares outstanding (in thousands) | 1,303,191 | 1,075,402 | |
| Adjusted net earnings attributable to shareholders of the Company per share–basic ($/share) | 0.06 | 0.10 | |
Photos accompanying this announcement are available at
https://www.globenewswire.com/NewsRoom/AttachmentNg/ce2da3cf-7d1b-4493-8014-083e63a0db04
https://www.globenewswire.com/NewsRoom/AttachmentNg/0a263180-53cb-42f0-a4ca-73432b9c6f8b
https://www.globenewswire.com/NewsRoom/AttachmentNg/0b1d46f9-559e-4326-a165-5a977ebef483
https://www.globenewswire.com/NewsRoom/AttachmentNg/3bd762a8-0cb0-4ce1-95a1-7526aee96ff2

For more information on B2Gold please visit the Company website at www.b2gold.com or contact:

Michael McDonald
VP, Investor Relations & Corporate Development
+1 604-681-8371
investor@b2gold.com

Cherry De Geer
Director, Corporate Communications
+1 604-681-8371
investor@b2gold.com

© Copyright Globe Newswire, Inc. All rights reserved. The information contained in this news report may not be published, broadcast or otherwise distributed without the prior written authority of Globe Newswire, Inc.


